
Cases
When alerts are sent to the alerts pane in incident response, the alerts can be reviewed again to determine if it’s beneficial to create a case. Cases are created if events have to be investigated further or more in depth.
To view the alert in incident response, click the three dot menu on the right and Click “Preview and import”
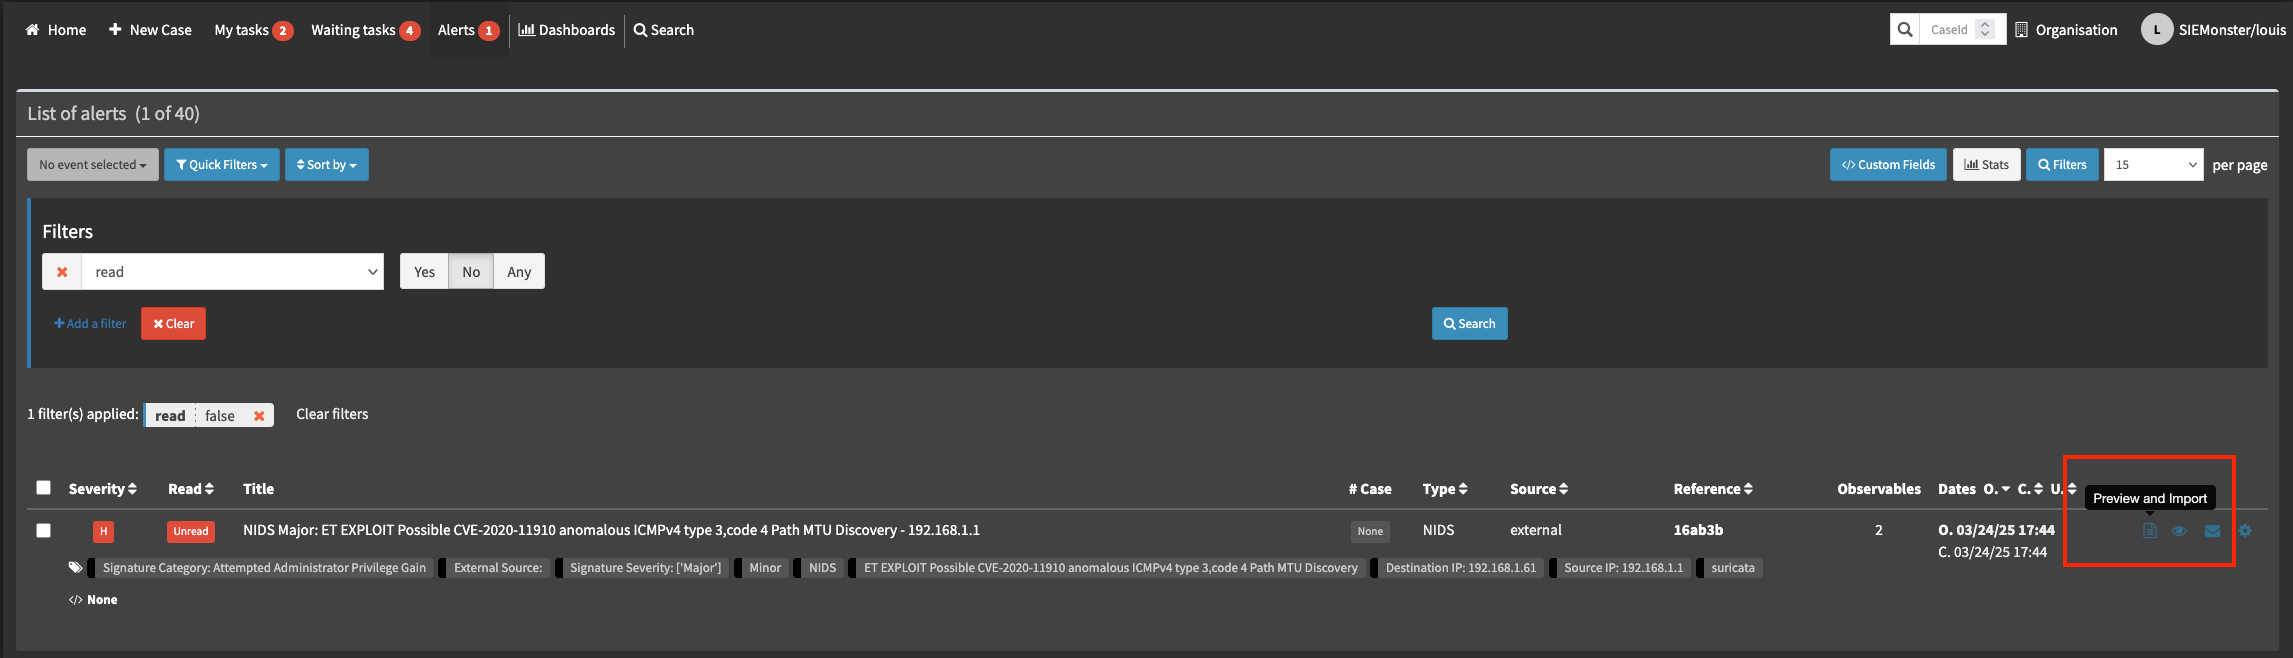
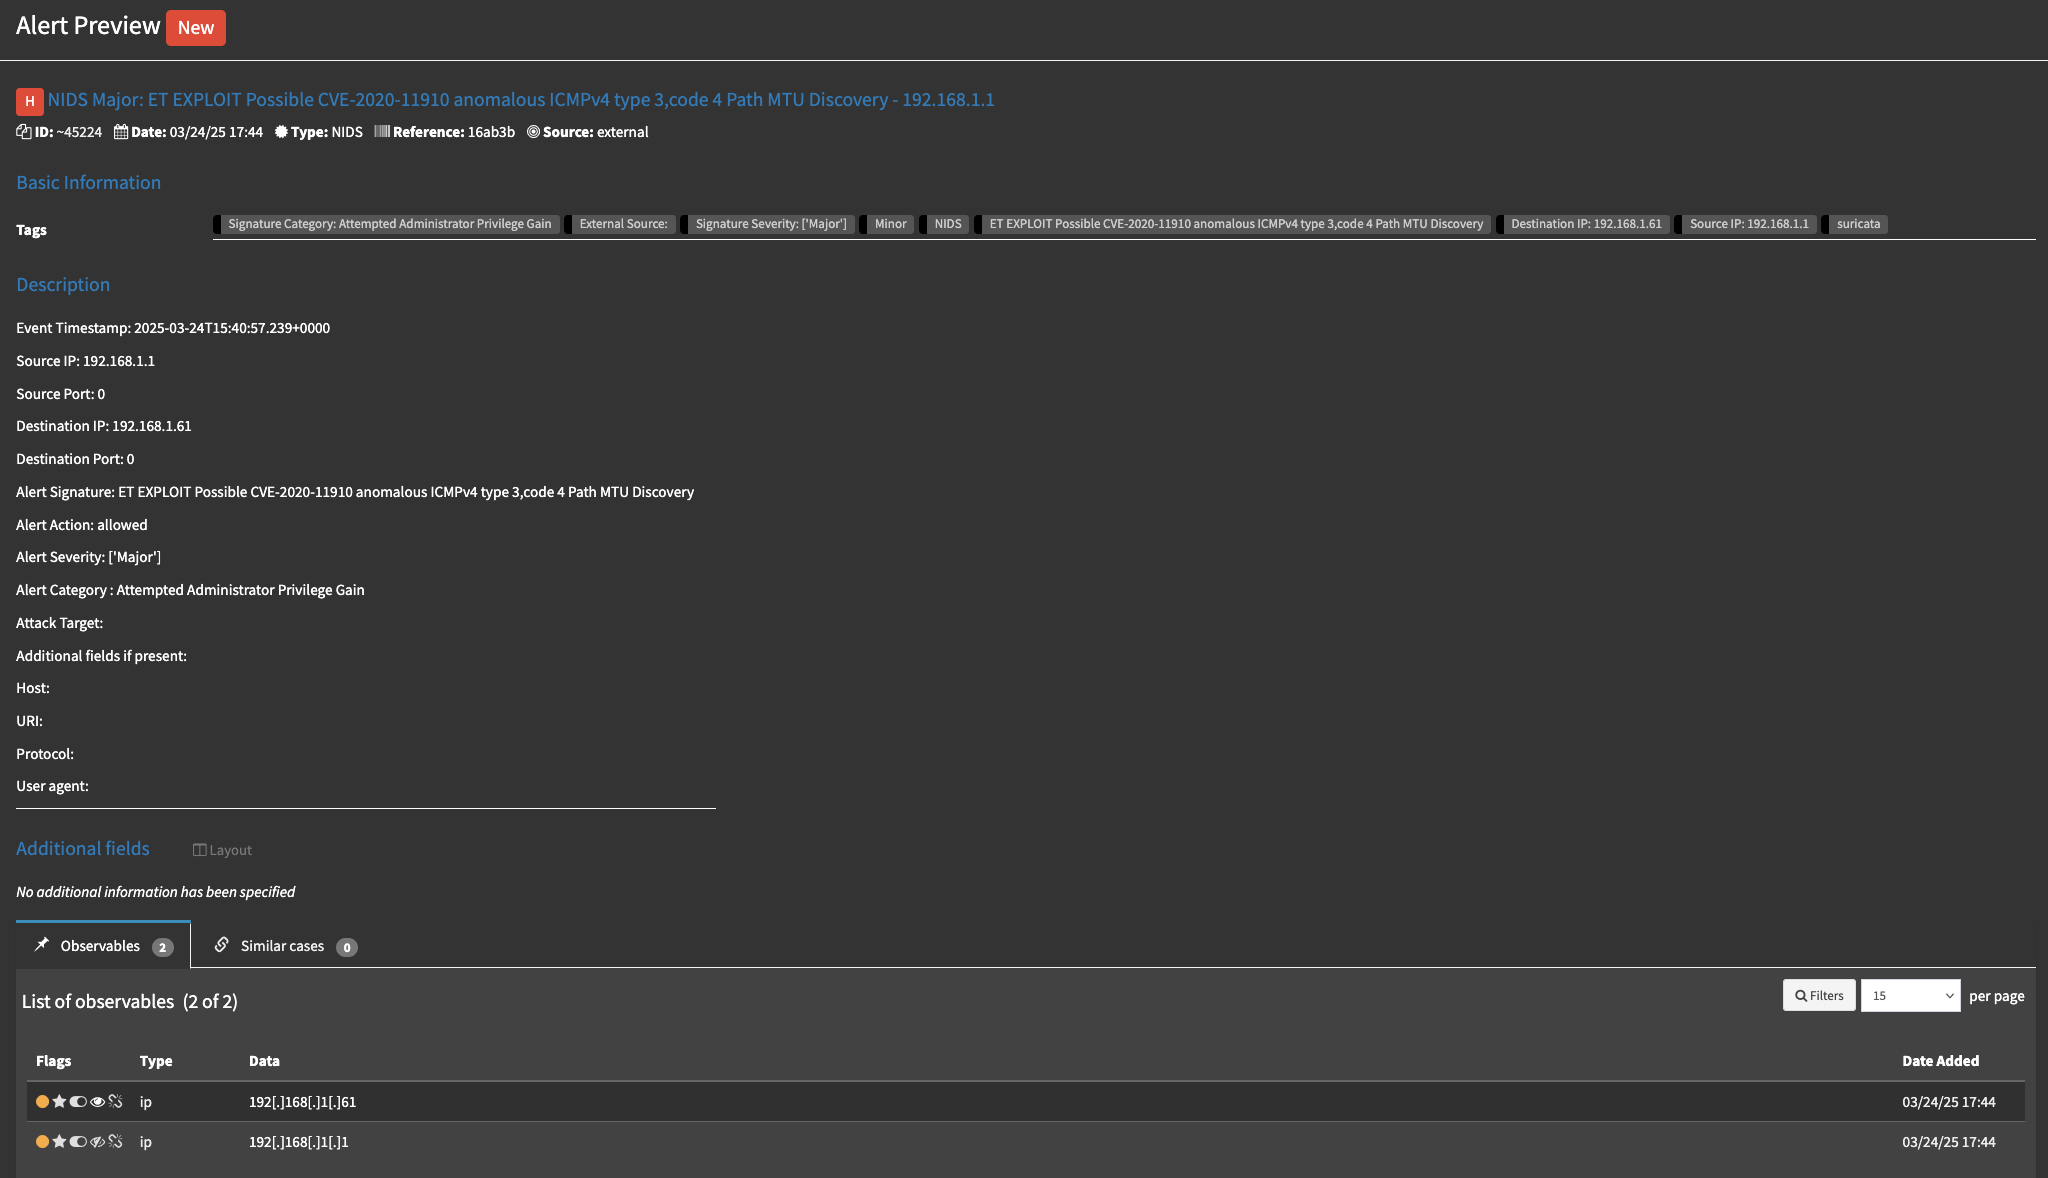
This will provide you with additional details such as observables, if they have been extracted by the alert rule.
Creating a case from an alert
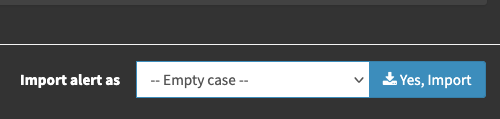
Depending on the policies and procedures for incident response in your organization, a decision can be made to take further action or not. If the choice is to perform a full investigation, the next step is to create a case from the alert. To do so, scroll to the bottom of the alert being previewed, select a case template if required and Click “yes, import”.
Then click “Import to case”
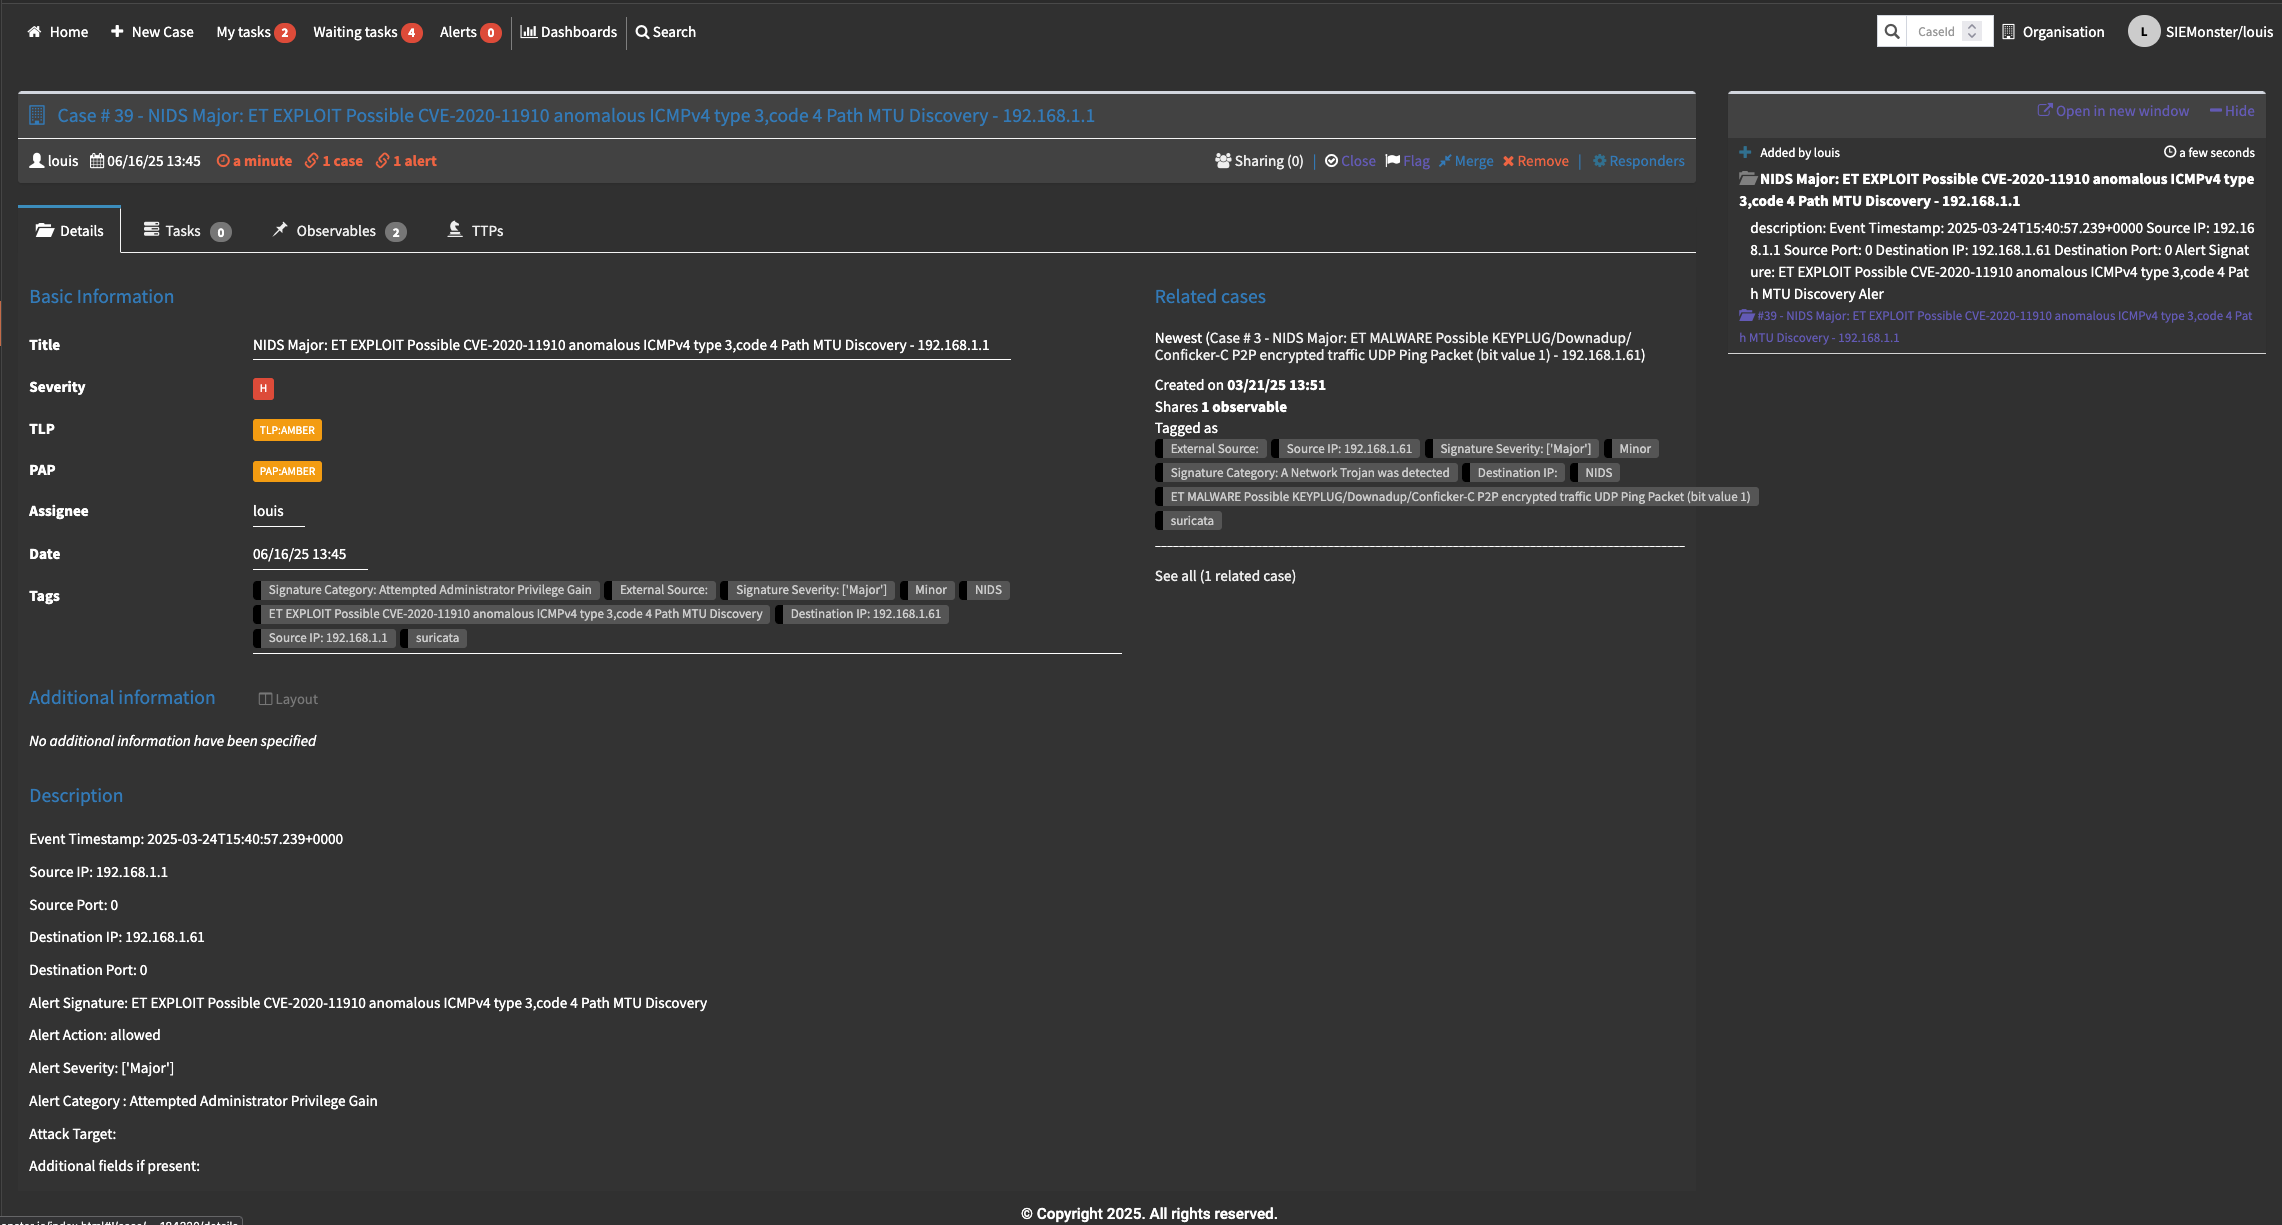
This will create a new case and redirect the screen to the new case that was opened.
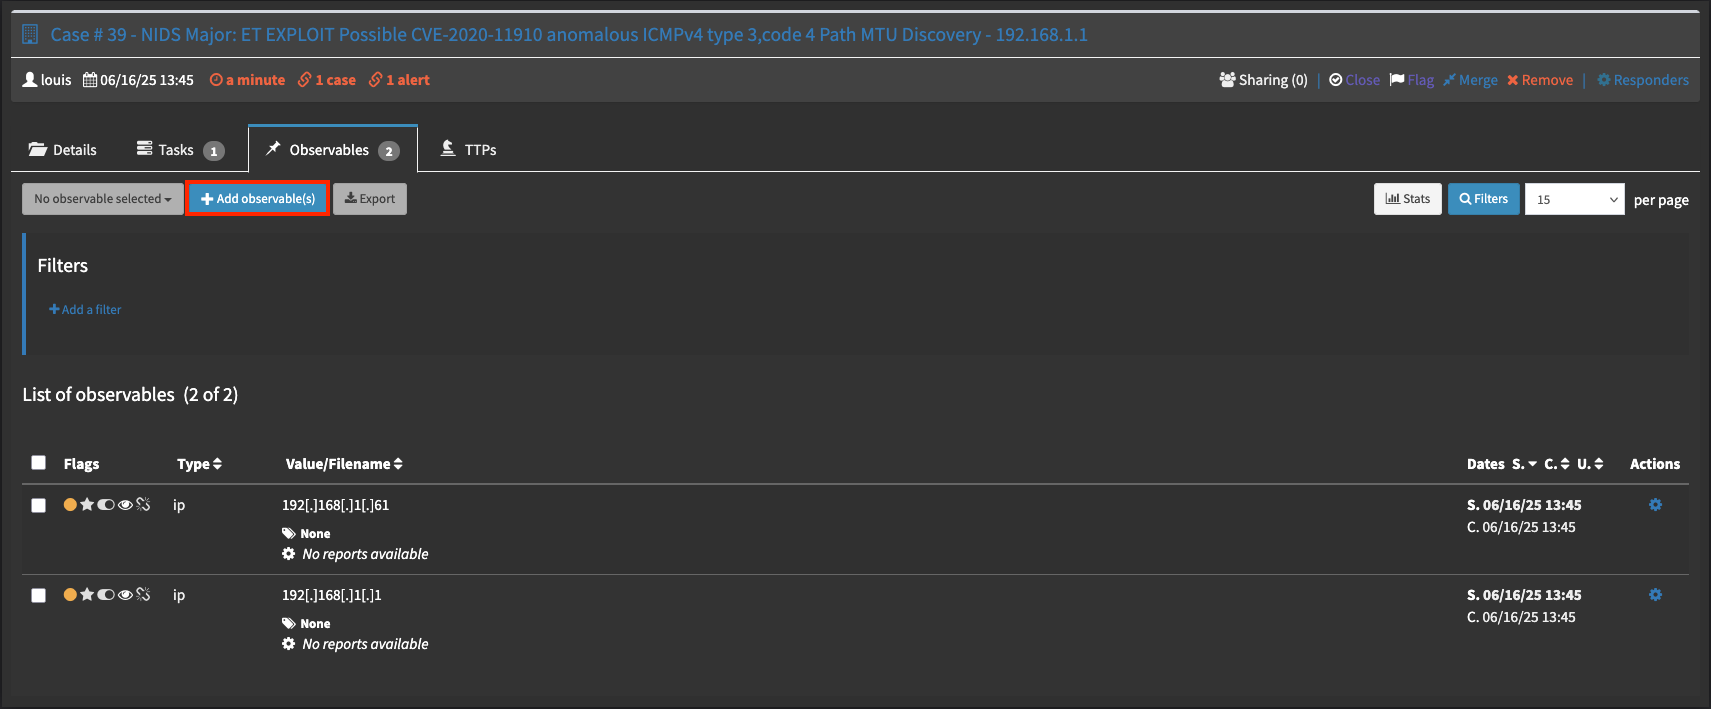
To view the case details, click on the three dot menu in the top right corner and click open details.
Information can be modified and added at this point to further advance the investigation such as additional observations, observables etc. Tasks can also be created and observables enriched.
Creating tasks
In many organizations, individual teams or team members perform specific functions. With cases, there are in many cases a need for such functions and actions to be allocated to a specific person, not necessarily the person performing the incident response. These tasks can be added on the tasks tab of th e case.
To add a new task, navigate to the Tasks tab, then click “Add Task” in the top left corner.
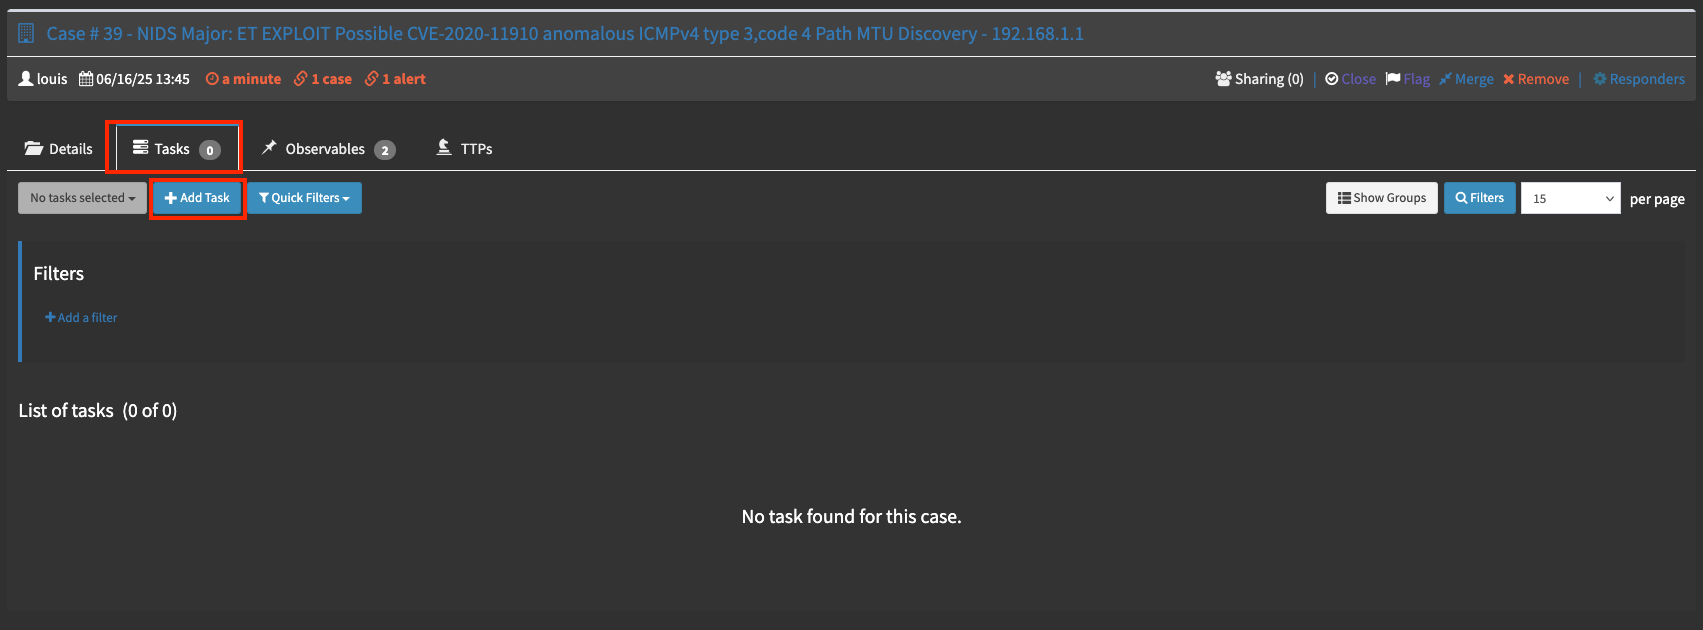
This will prompt you for the group and a name for the task. The title can be anything but should be descriptive enough for understanding by the individual it will be assigned to. The group is optional and not compulsory. Once completed Click the “correct” checkmark.

Once the task has been created it will be listed in the Tasks tab
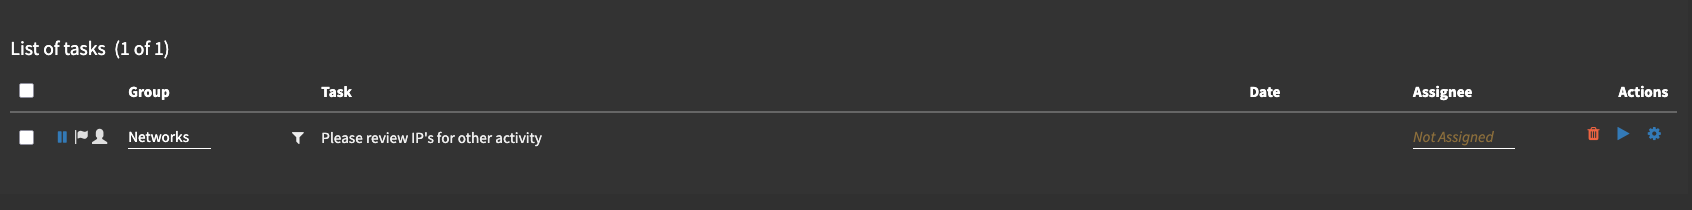
You can click on the task to expand it’s details. Here the details can be edited by clicking the pencil at the end of each line. The first step is to assign it to the party that will be doing the tasks.
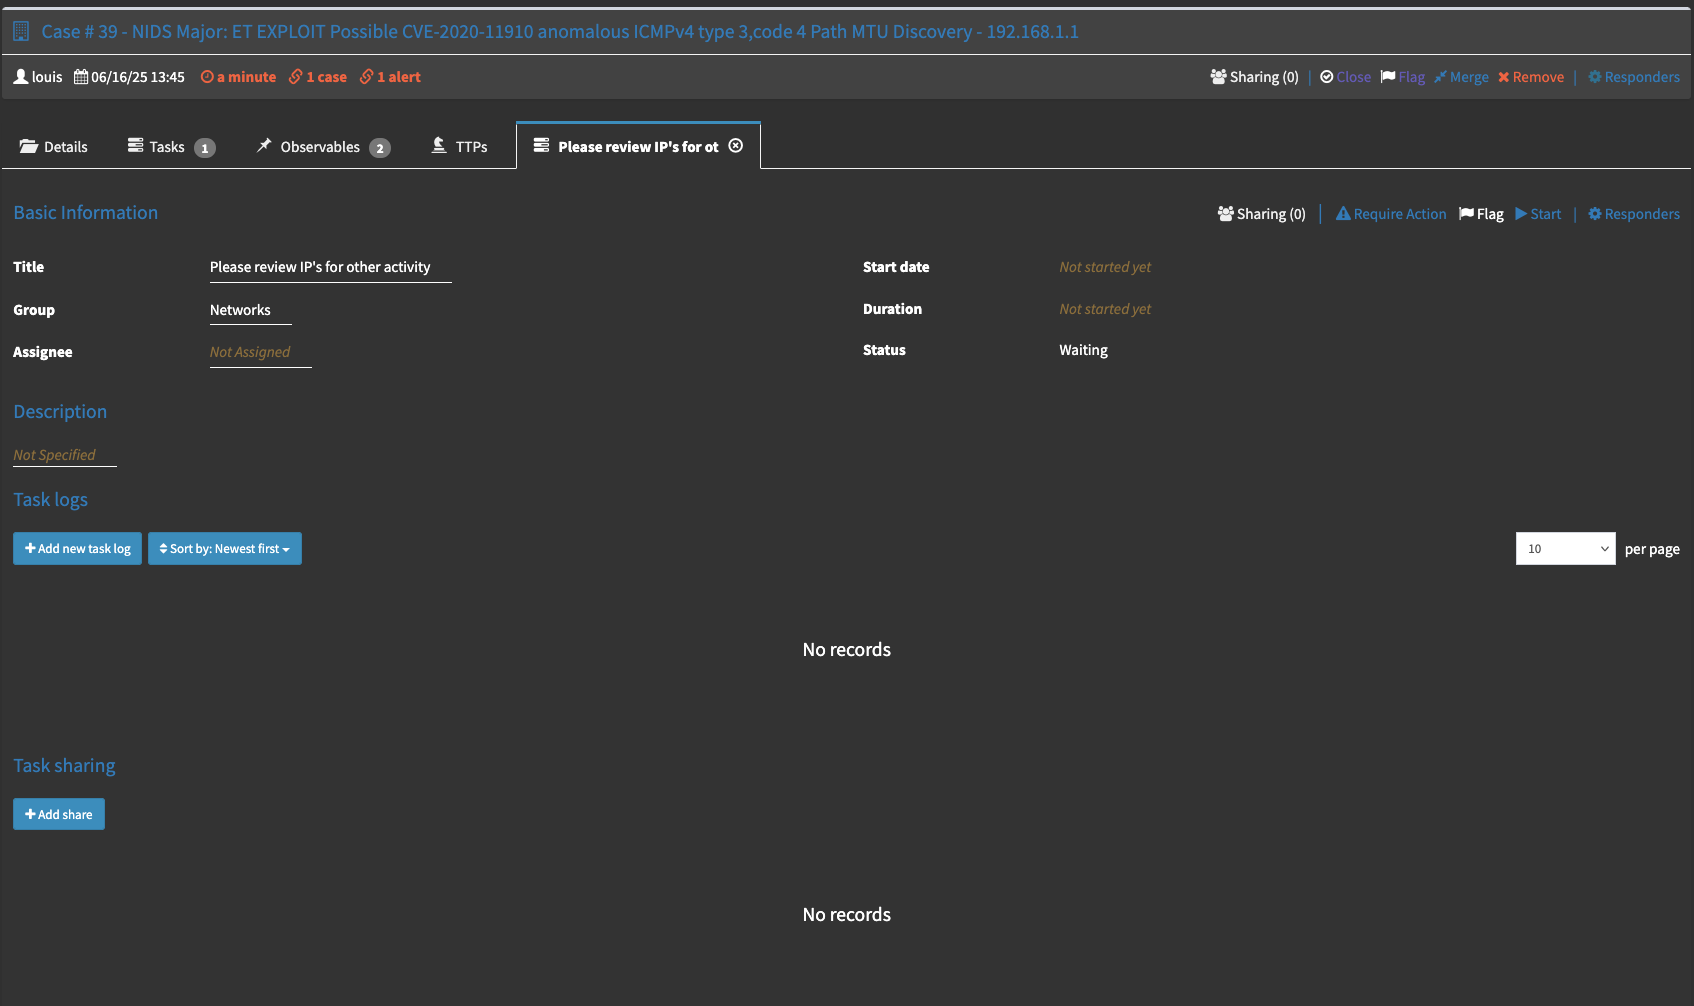

When the individual it is assigned to wants to start processing the task, they have to click the start icon in the top right corner.
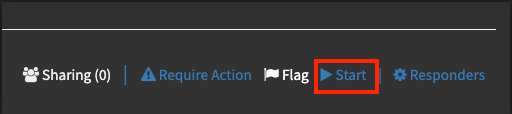
This will update the status of the ticket to active.
Once the action items are completed they can close the task by clicking the Clicking the “Close” option at the top right.
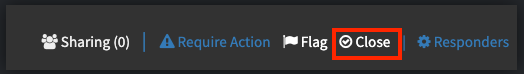
Which will change the status to closed.
Observables
Observables can be enrich with intelligence sources available to the incident response module. These sources/analyzers were covered in the analyzers section. Additional observables can be added as needed manually or automatically extracted by the alert rules. Please see the alerting and rules section for further details.
Adding Observables
To add an observable, go to the observable pane after opening the relevant case. Some observables that were extracted from the event automatically may already be present. To manually add more, click the “Add Observable(s)” button in the top left corner.
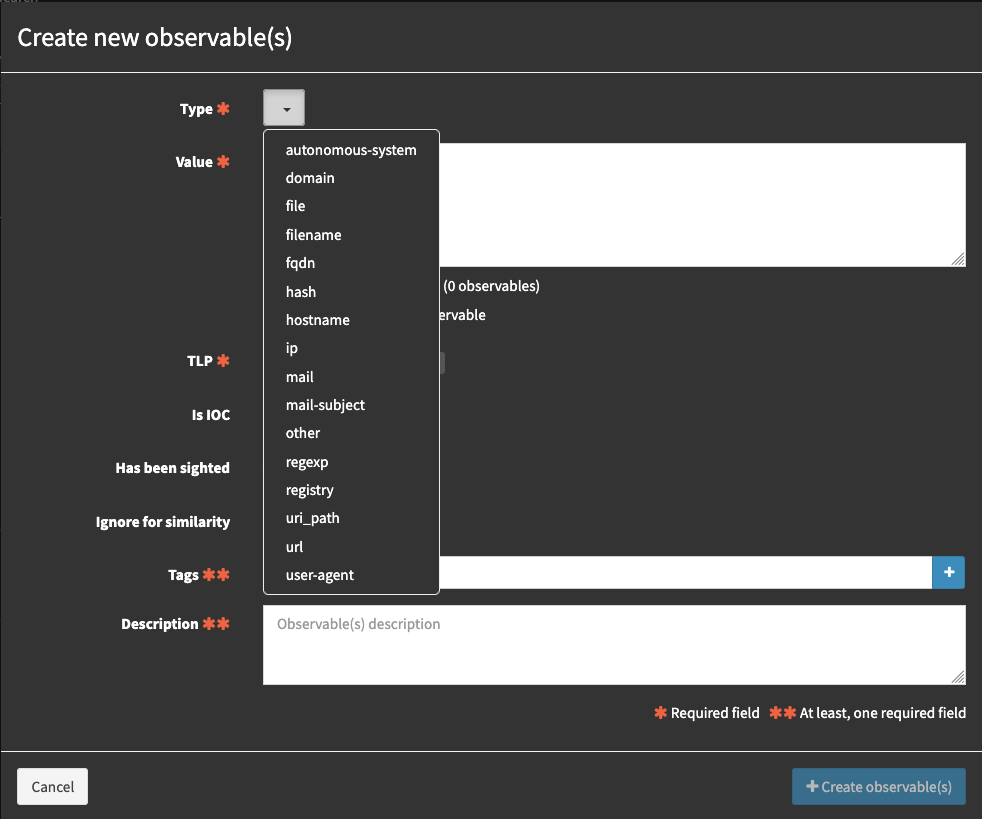
From the first dropdown select the observable type. There are quite a few types to choose from, please note it is extremely important to click the correct type for enrichment to function correctly.
In the value field, type or paste the observable that needs to be investigated.
🔖 NOTE: you can specify multiple of the same type of observable, please ensure to select the appropriate radio button for the formatting of the observable.
Specify the TLP, more information on the specifications for this can be found here
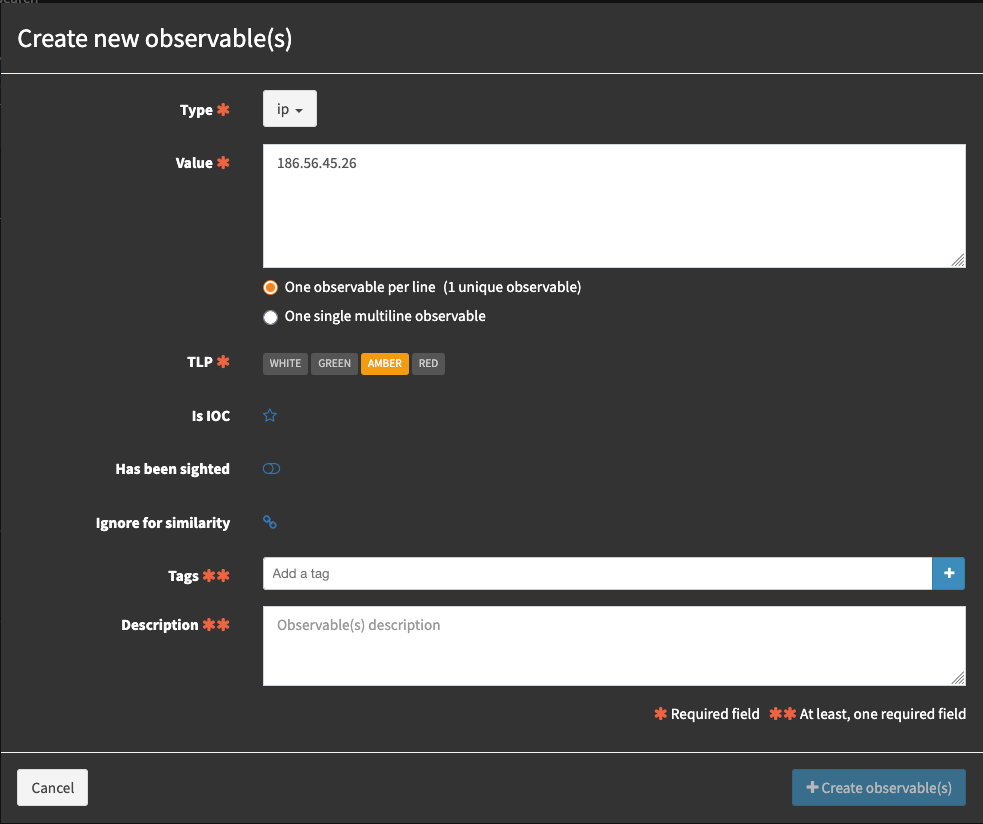
In the select tags section, add tags as needed and press enter after each. Tags are useful for filtering and reporting. In the next section add a description for the observable. Finally Click confirm. Your observable has now been added.
Enriching an observable.
To enrich an observable is a simple process. Simply click on the desired observable and select the Analyzer you wish to run against it, click the Flame icon to the right, if you have run it before and wish to run it again the icon will look orange with a circular arrow.

You will see a turning gear indicator while the analyzer waits for a response from the intelligence source.

Once the enrichment completes, a success tick mark will be present under status

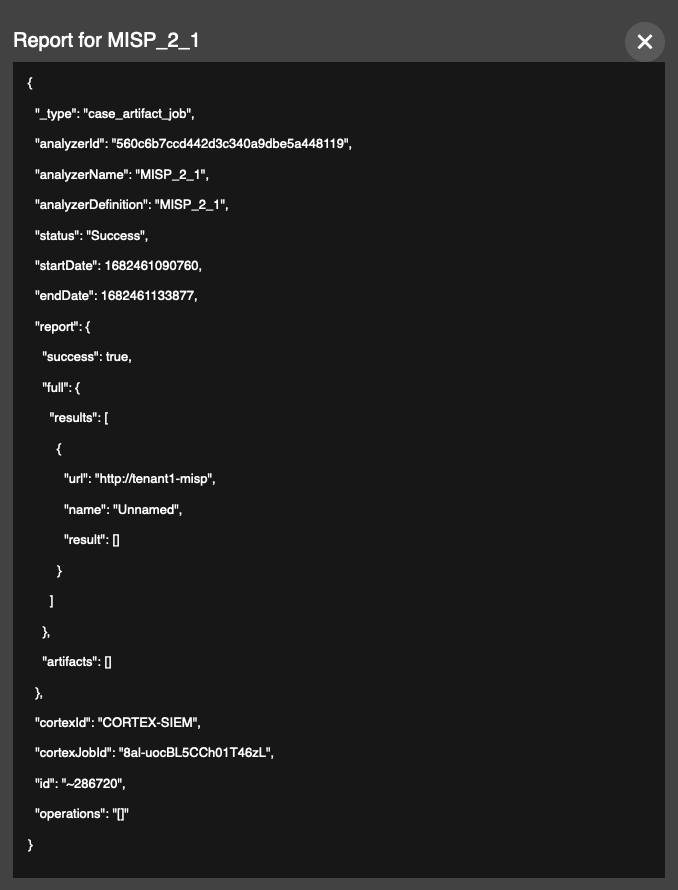
You can click the timestamp on the far right to see the enrichment result.

Now proceed to click on the little eye to see the output received.
Additional formatting is being developed to present this in a more user friendly manner in future releases. Your event is now enriched and you can decide if the information provided warrants further action such as blocking on the firewall or running an Antivirus scan on the source host (if internal) of the alert. In this case the result was inconclusive