
Editing and reviewing default alerts
The default alerting rules that are shipped with SIEMonster can be found in the Rules Tab of the Alerts pane.
Rule page navigation
To view a rule, select the relevant rule from the dropdown list. In the following examples various different rules will be used for demonstration purposes.
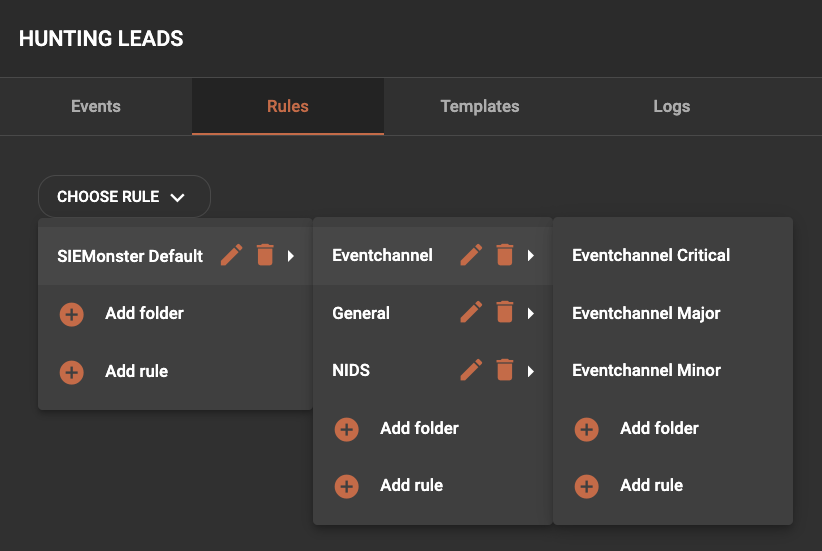
Once the rule is selected, the rule display will be shown.
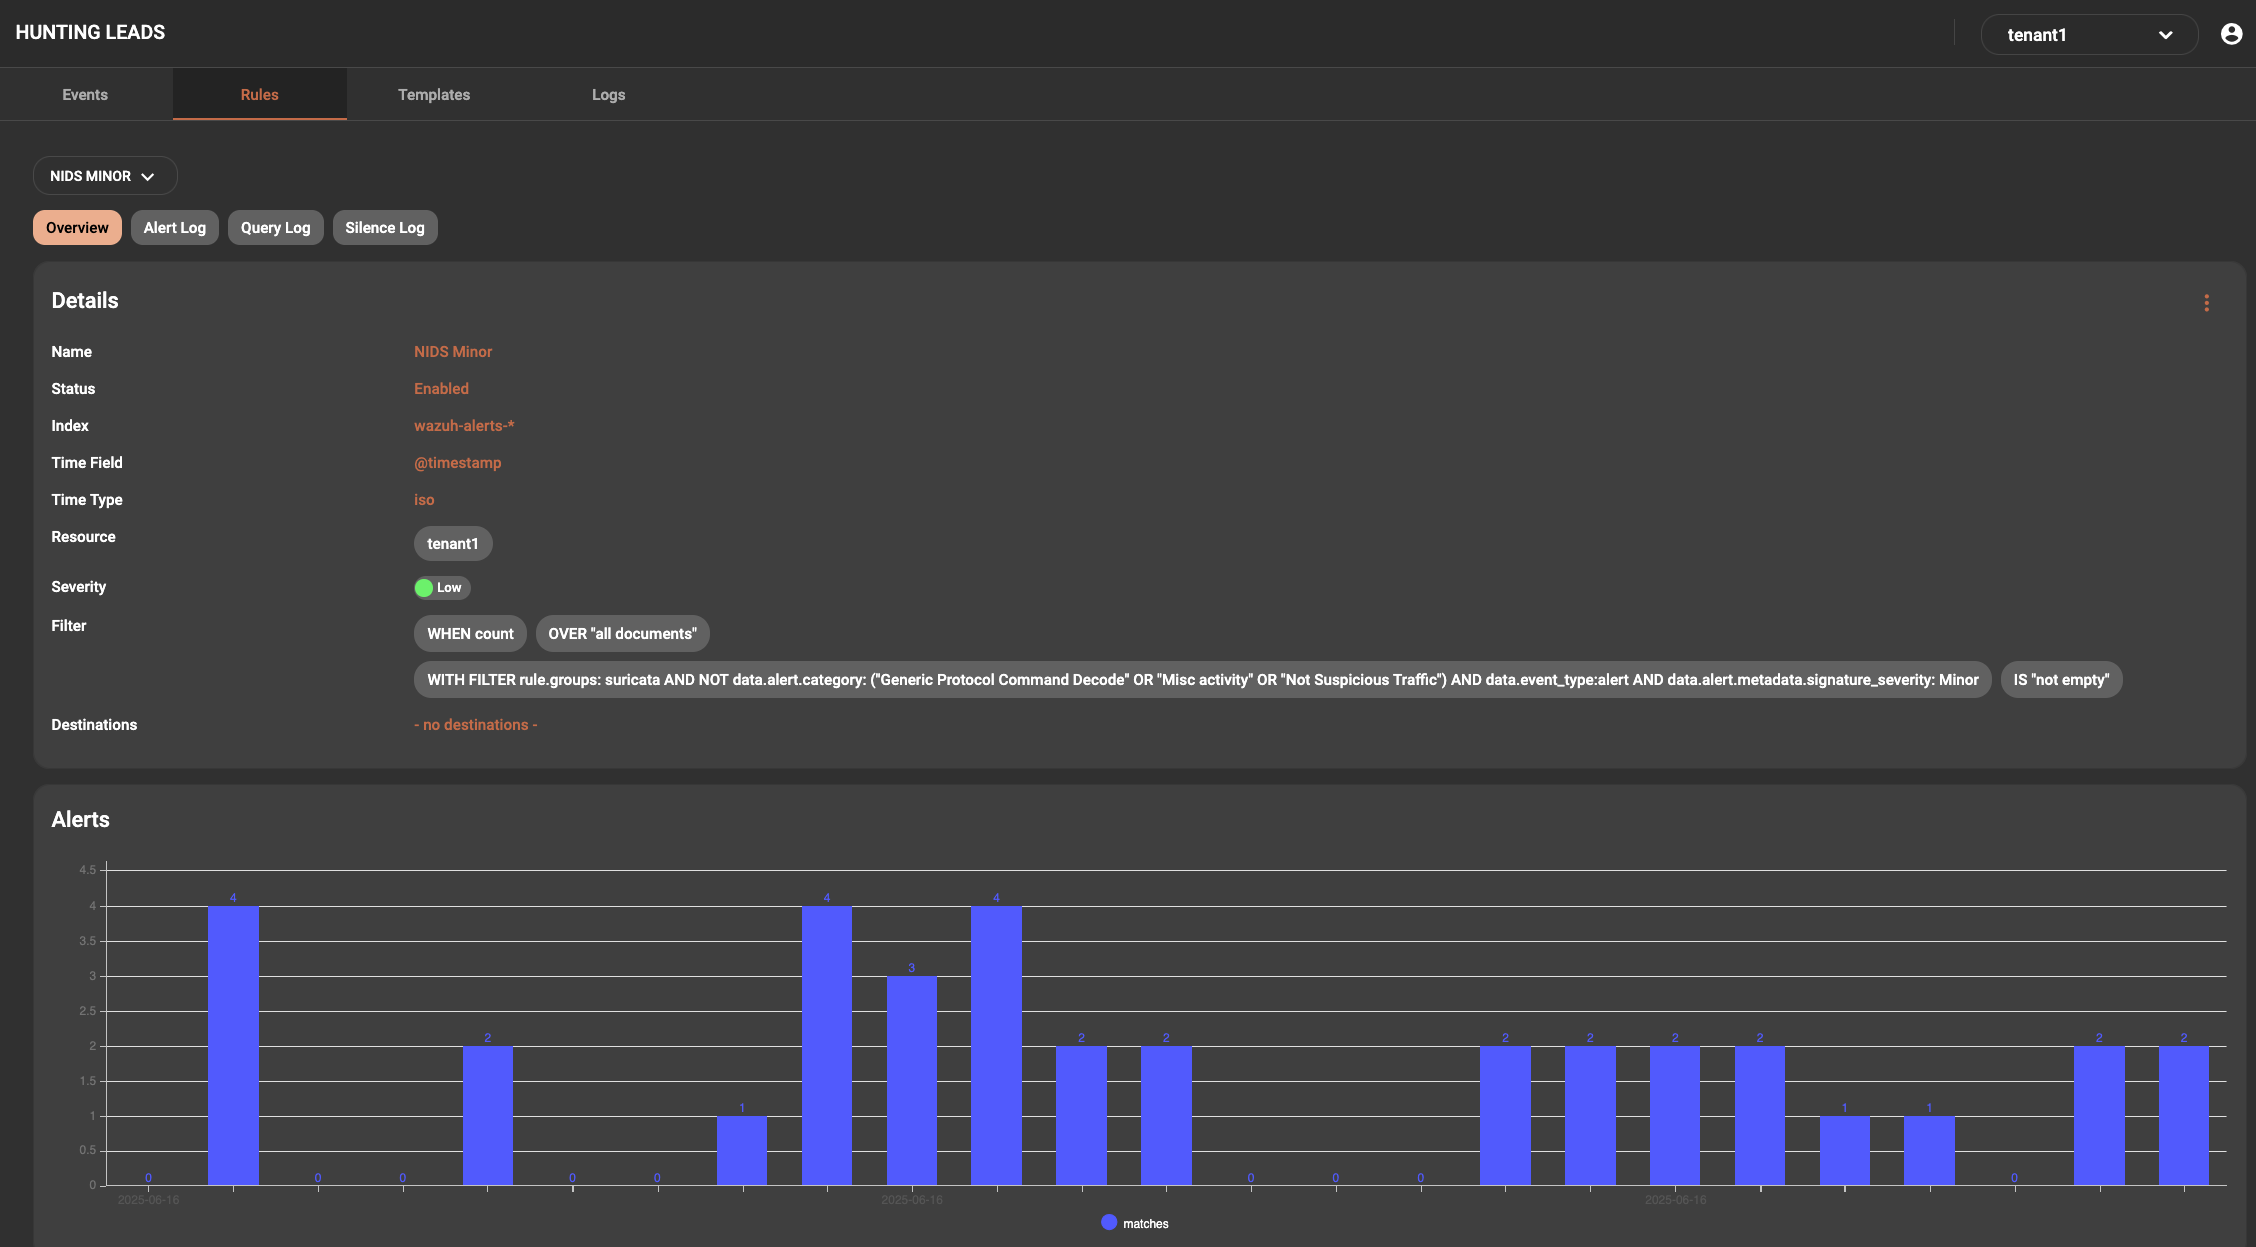
In this display it will list the details of the various aspect relevant to the alert.
At the top there will be overview, alert log, query log and silence log tabs
The Overview tab is the default shown with the details of the rule. This is also the view that rules are edited in.
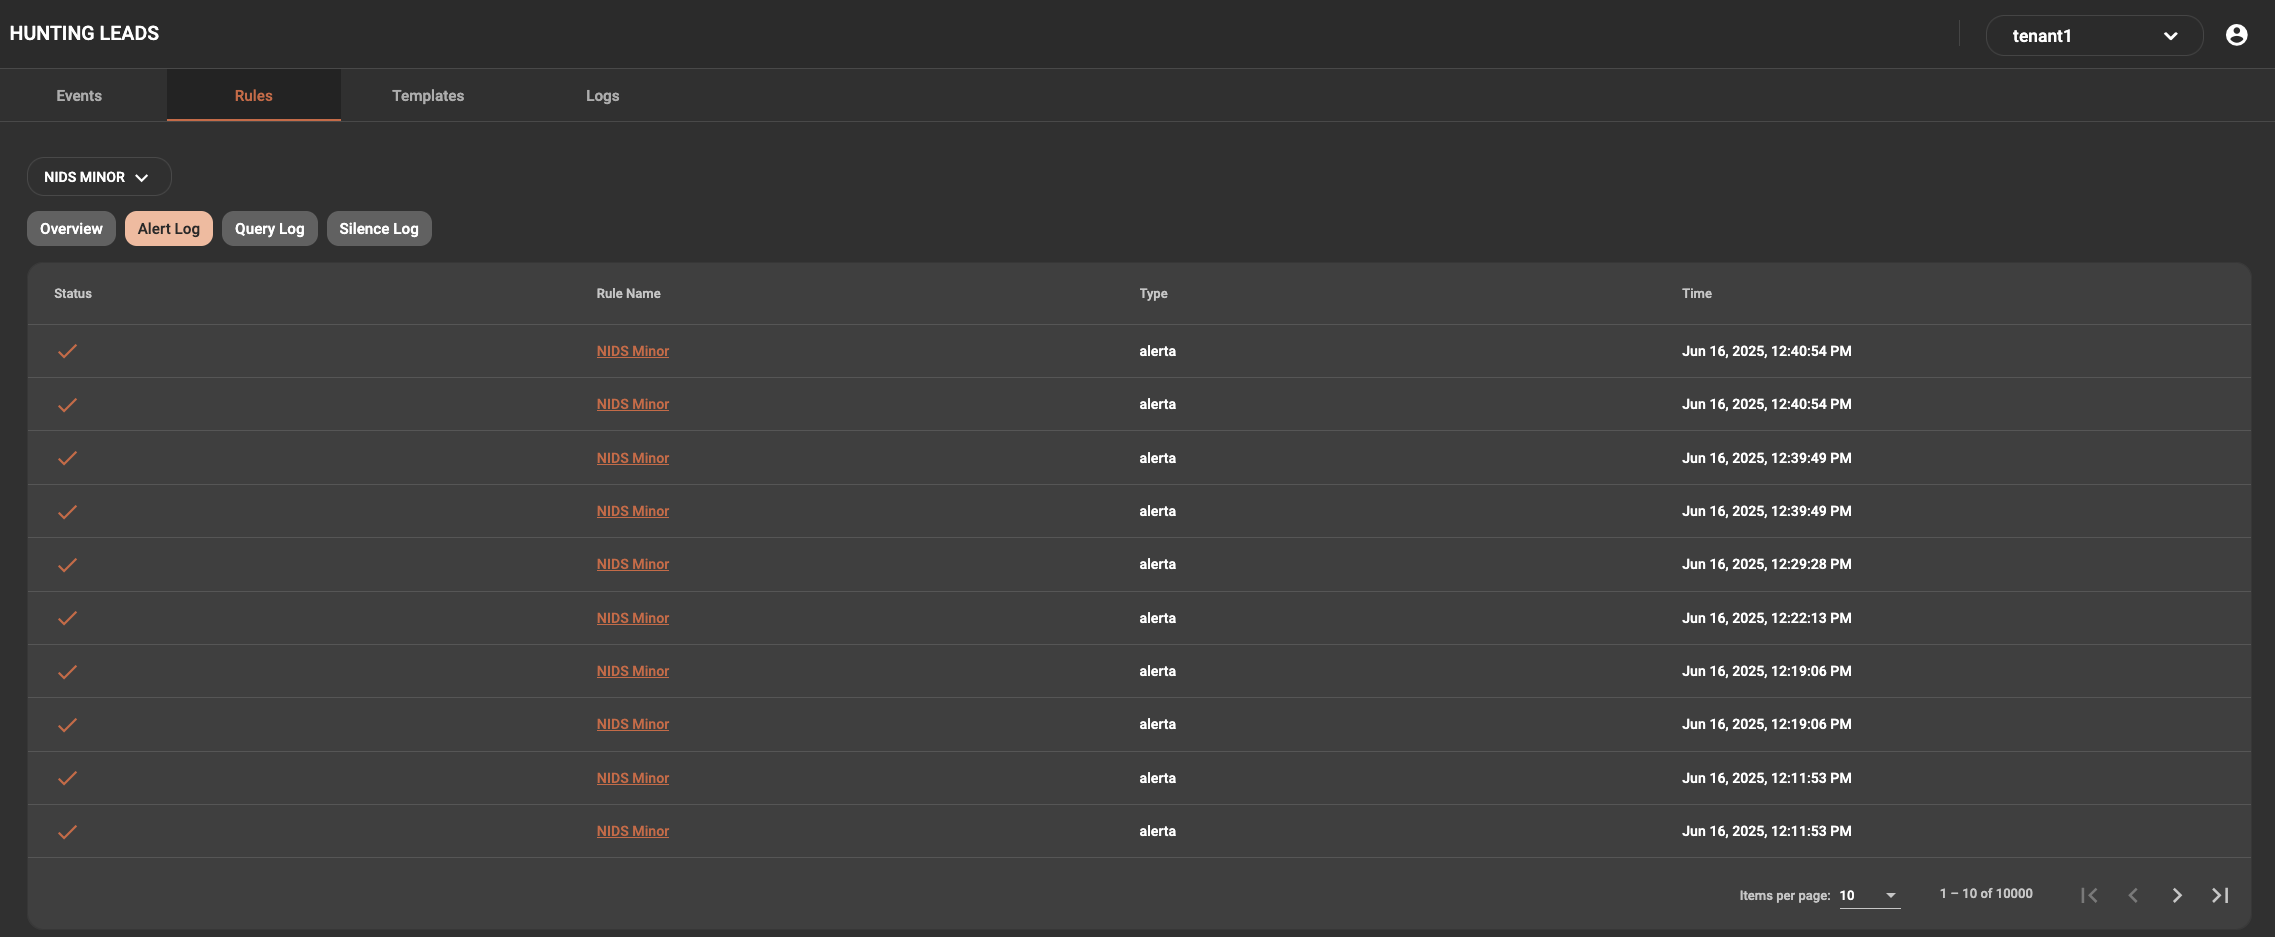
The alert log will show the alerts triggered by this rule with a timestamp. This allows the user to see when the last alert was generated.
The Query log tab will show the last time the rule was queried against the data regardless of matches found. This is primarily used for troubleshooting if rules are functional.
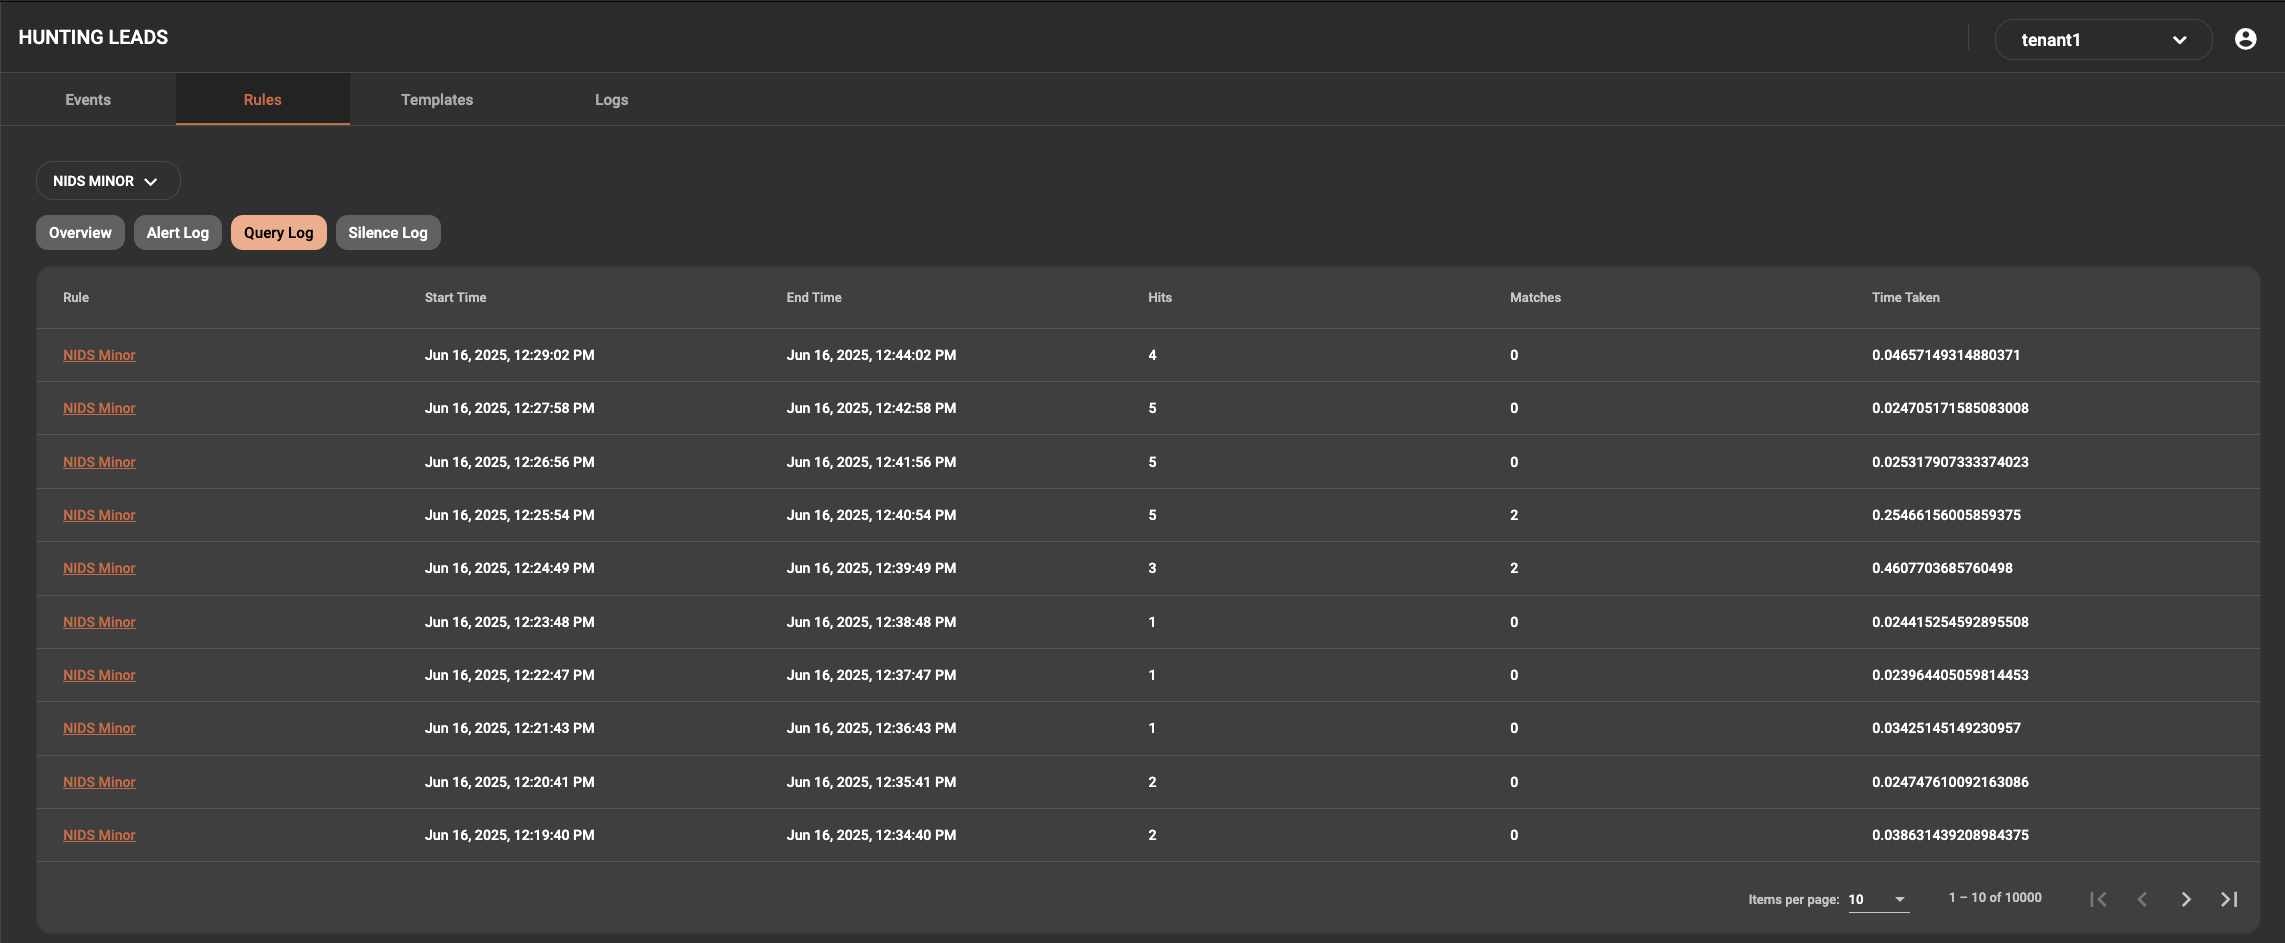
This view include the rule name, start time, end time, hits, matches and time taken. The important column here is the matches. If you have matches in the column but no alerts being displayed, this is an indication of a problem.
The time taken is also important as it shows how long the query took to complete. If a rule has been poorly constructed and returns too many positive matches it will have an impact on system performance and ultimately the reliability of the alerts being generated.
The last tab is the silence log. If there are noisy rules that generate a lot of alerts, the system will protect itself by silencing the alerts. If this tab is empty it is a good sign that the rules are properly crafted and are not being burdensome to the performance of the environment.
Rule action menu
To edit a rule, please ensure to have the correct rule selected from the dropdown list as displayed at the beginning of the page. You will also need to be on the Overview tab of the rule.
On the right hand side there are three vertical dots that can be clicked to open the dropdown menu with the various options available.
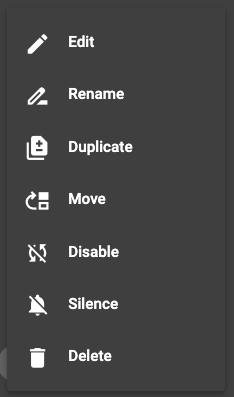
From here the rule can be selected for editing, it can be renamed, duplicated, silenced and deleted. Editing covers a whole aspect that will be reviewed more in depth below. Renaming just renames the rule for whatever reason. Duplicate allows the rule to be duplicated in case a rule has similar criteria to what is required but will be modified further, rename is recommended after this as it will have the same name with a number indicator at the end to show it’s a duplicate e.g. NIDS Mintor (1).
Disable will disable the rule and prevent further processing. This is useful when a rule is extremely “noisy” and requires refinement but sending the alerts to the event dashboard during the fine tuning process is unwanted. Silence means the rule is still active but it won’t send alerts while silenced. It can be unsilenced afterward.
The delete option will delete the rule permanently.
Rule editing and review
In the rule action menu, when the edit option is selected, the following screen will be displayed with the configuration of the selected alerting rule.
Details Section

In the details section it shows the name of the rule, the index against which lookups are performed, the timestamp type and the timestamp field selection. These fields will be static for most cases as the index pattern and timestamps utilized are normalized. Modification will only be needed if low level alterations are made tot the ingestion flow.
Filter section

The filter section includes the items needed to filter events to those that are needed. The options for selection here are when, over, with filter and is. The when, over and is options are currently static with future development including additional parameters for these. The filter option is where the focus lies currently.
Filters can be based on the following concepts:
Positive matching
Negative matching
Hybrid matching
Positive Matching
Positive matching is where the field and value is known. It is a very efficient mechanism for rule construction and uses the least amount of resources as a starting point. An example of this is choosing something like a subset of alert sources based on rule groups or decoder names e.g. rule.groups: suricata, decoder.name:windows_eventchannel. This will trim the initial results to specific data items.
Negative Matching
Negative matching is not efficient when used as a start for a filter as it will exclude the item you specify but leave all other results that don’t match. An example of negative matching is NOT rule.groups: suricata. This will exclude suricata linked events but retain all other events. It is not recommended to use negative matching on it’s own or as a starting point in a filter
Hybrid Matching
Hybrid matching is a combination of positive and negative matching for rule refinement. Depending on how it is structured it can be highly efficient and accurate. In general this type of filtering is recommended. The default rules included in the system are also based on this type of filtering and can be used as baseline examples for custom rule creation specific to your environment.
rule.groups: suricata AND data.event_type:alert AND data.alert.severity:3 AND NOT data.alert.category: ("Not Suspicious Traffic" OR "Generic Protocol Command Decode")If you review the above example you will note that the hybrid rule first does a positive match on events from Suricata, data.event_type of alert and the data.alert.severity. This is a very precise subset of events that are received from Suricata. The results are then further refined to remove spurious or superfluous events based on data.alert.category. Thus leaving only the pertinent events that the SOC should review. Further revision can be performed to split out the alerts for other categories within the subset etc.
Rule formatting
Rule formatting most commonly used in the construction of filters are the following:
<>:””()
If you review the sample rule above you will note that the construction of the filter is in the following format
Single value: field: “value”
Multi value OR: field: (“value” OR “value”)
Multi value AND: field: (“value” AND “value”)
It is always recommended to encapsulated the value being searched for in quotes. It can be noted that the system can function without this but it is not efficient to do so and may have a significant impact on rule and system performance. Below is an example where the greater than and small than operators are used.
decoder.name:"windows_eventchannel" AND rule.level:>8 AND rule.level:<11🔖 NOTE: If testing for this wants to be carried to events search it is required to remove the : before the <> operators as KQL does not use it in the same way as the rule engine.
Settings Section
The settings section contains explicit configuration items for the rule being edited. The realert duration is the window in which the rule engine will prevent a rule from resending. A value of 0 means it’s disabled and it will live stream alerts. This can be set to numerous values if flooding is occurring with identical events. If the realert is set to five minutes, the rule engine will only send one matching event per 5 minute window.
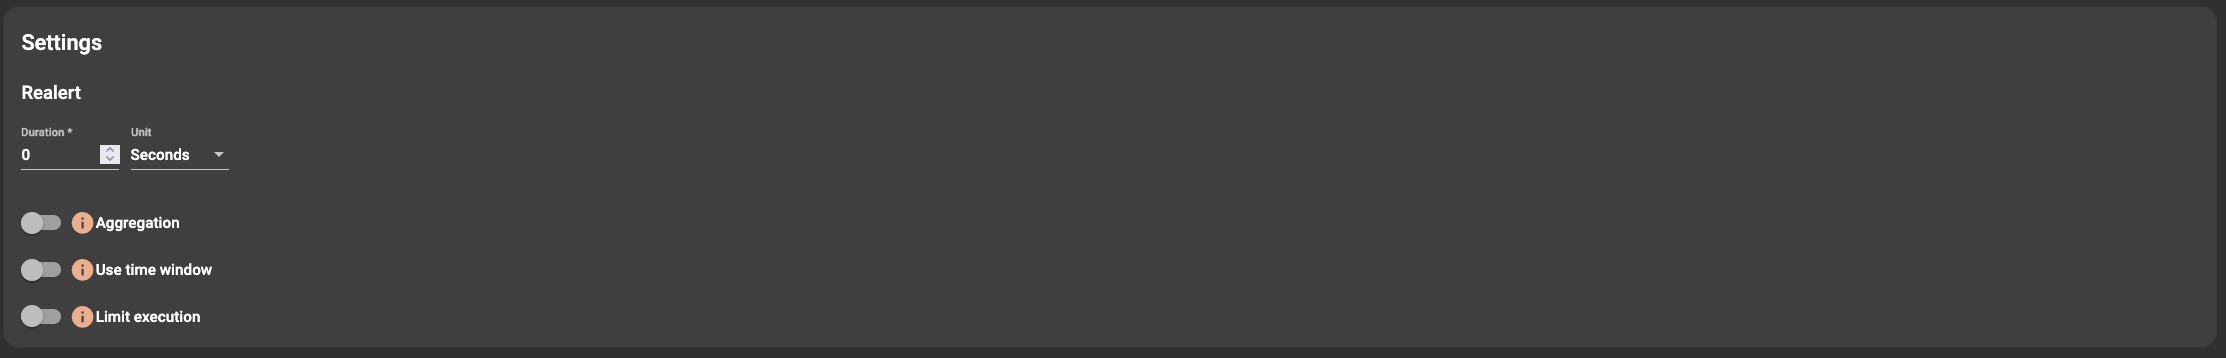
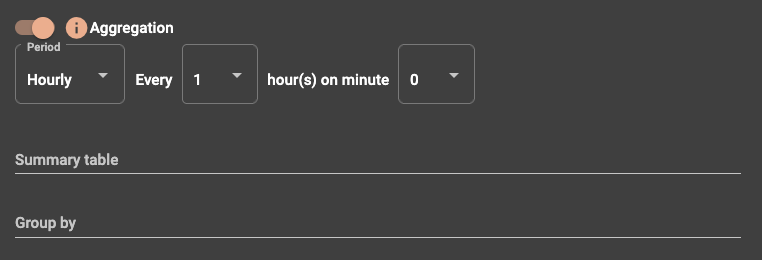
Aggregation will accumulate events and send through the summary as per the setting specified
The use time window option will limit alert sending to the window of hours specified.

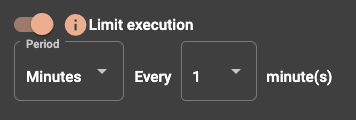
Limit execution will only allow the rule to run within the time parameters specified.
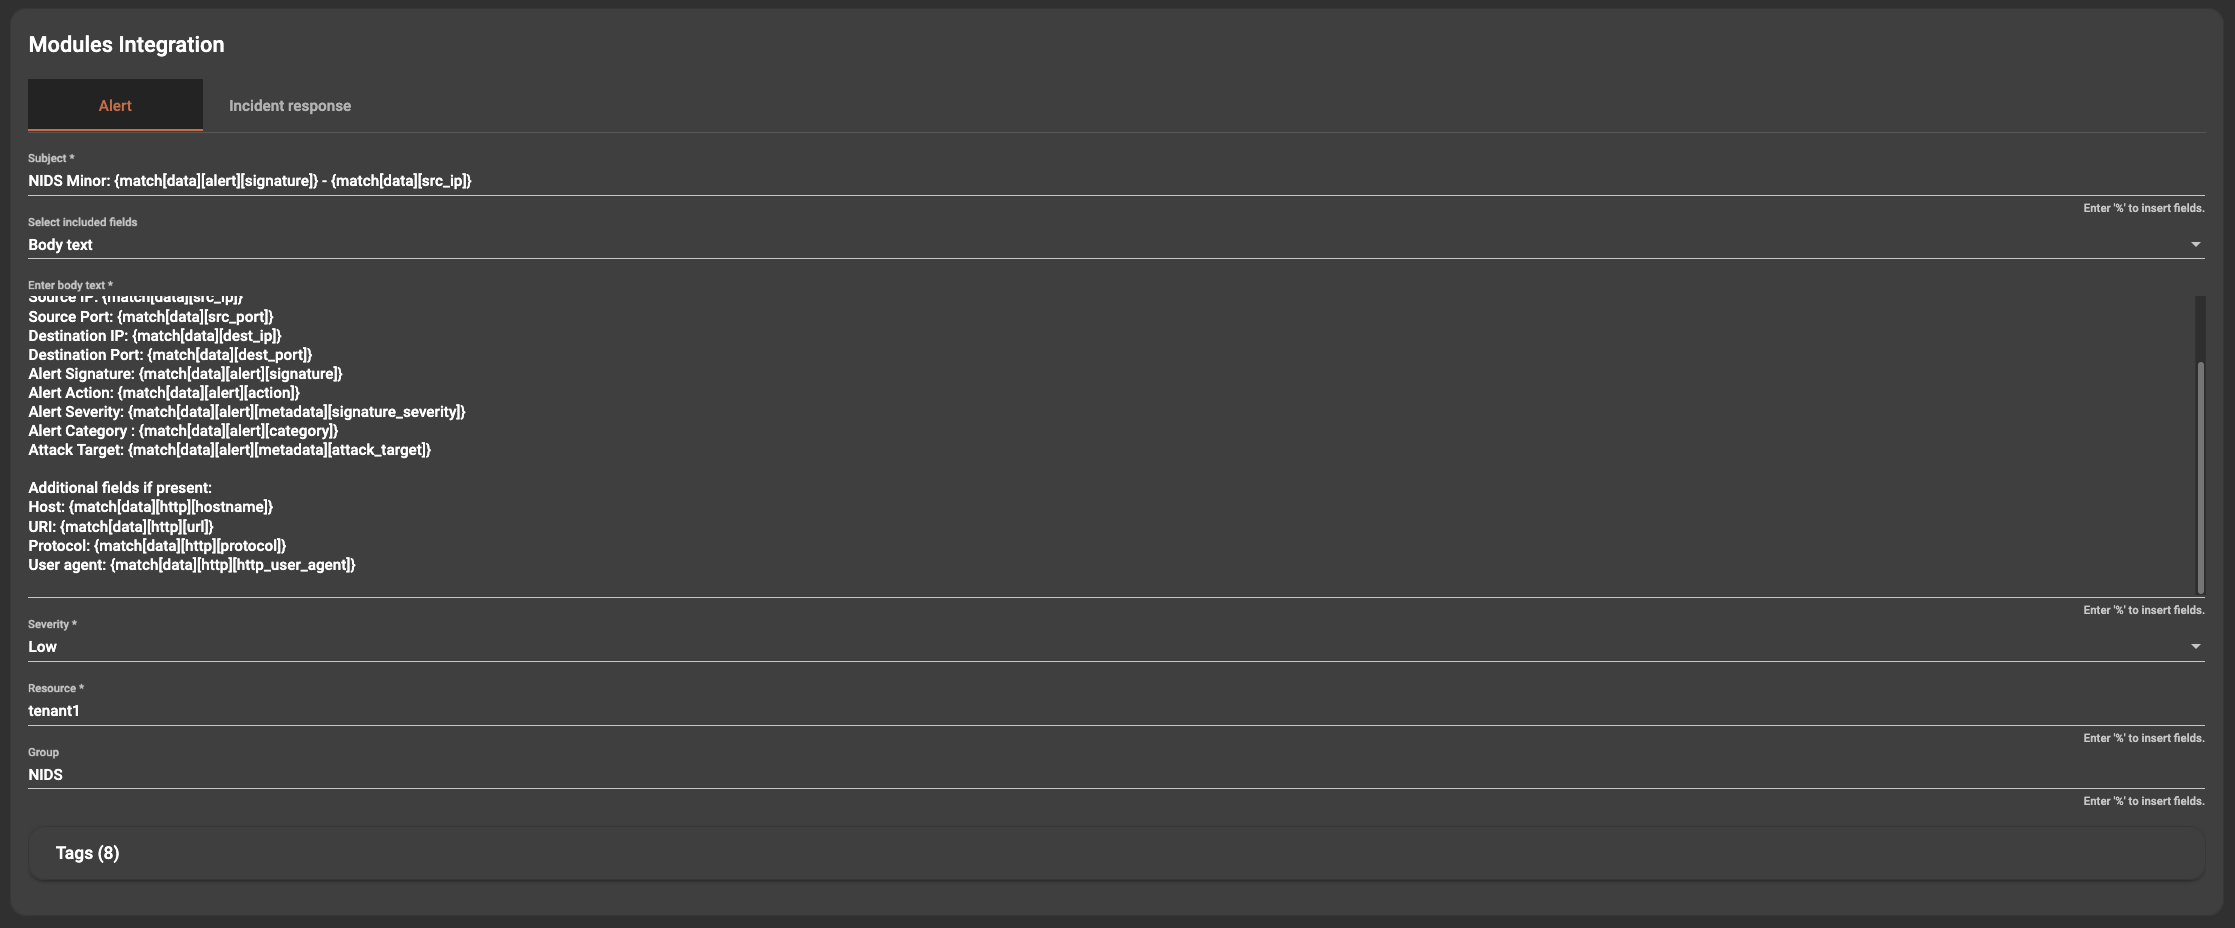
Modules Integration
The destinations section contains the formatting of the event that will be sent to the events dashboard. This can be completely customized based on the specific organization requirements. The majority of the fields supports variable integration meaning that field values can be extracted from the event being processed and used as text, tags, observables or other classifiers in the event being shipped to the event dashboard.
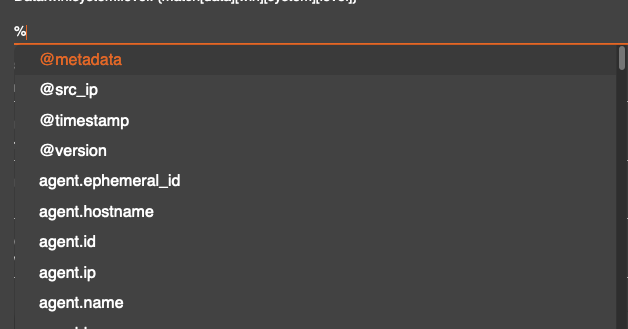
The variables can be access by pressing the % key, this will produce a drop down menu that supports scrolling or typing to find the preferred field.
The body text is important for the user/operator receiving the event for review, and the tags are important for filtering reporting and also matching incident response cases. It is important to include unique items such as source and destination IP’s as tags etc. Please review the rules supplied with the system for more examples.
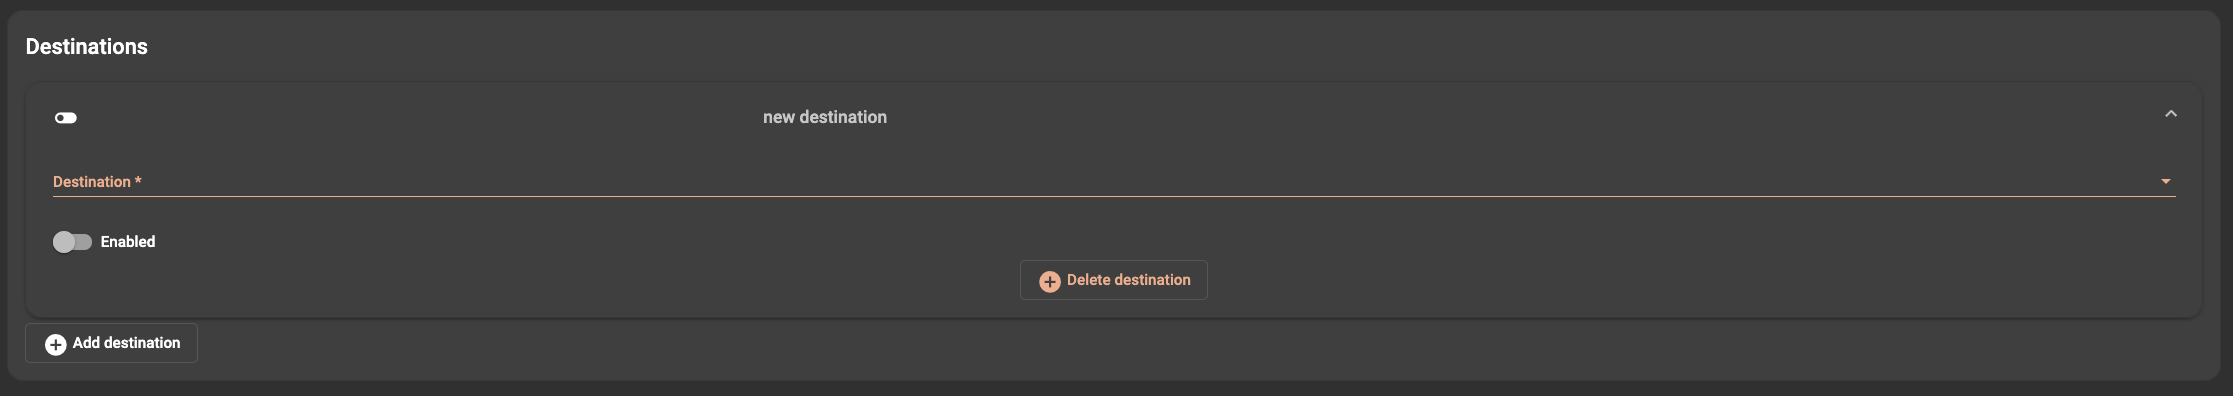
Destinations for the specific Hunting Lead to be sent additionally to the Hunting Leads dashboard can also be configured here.
Incident Response Tab
When editing the destinations section, there is a tab for the data that will be sent as additional items to the incident response component if event has been chosen to be transferred. The process of that will be covered in the next section of the documentation. It is important to note the fields that need to be populated for this to be effective.
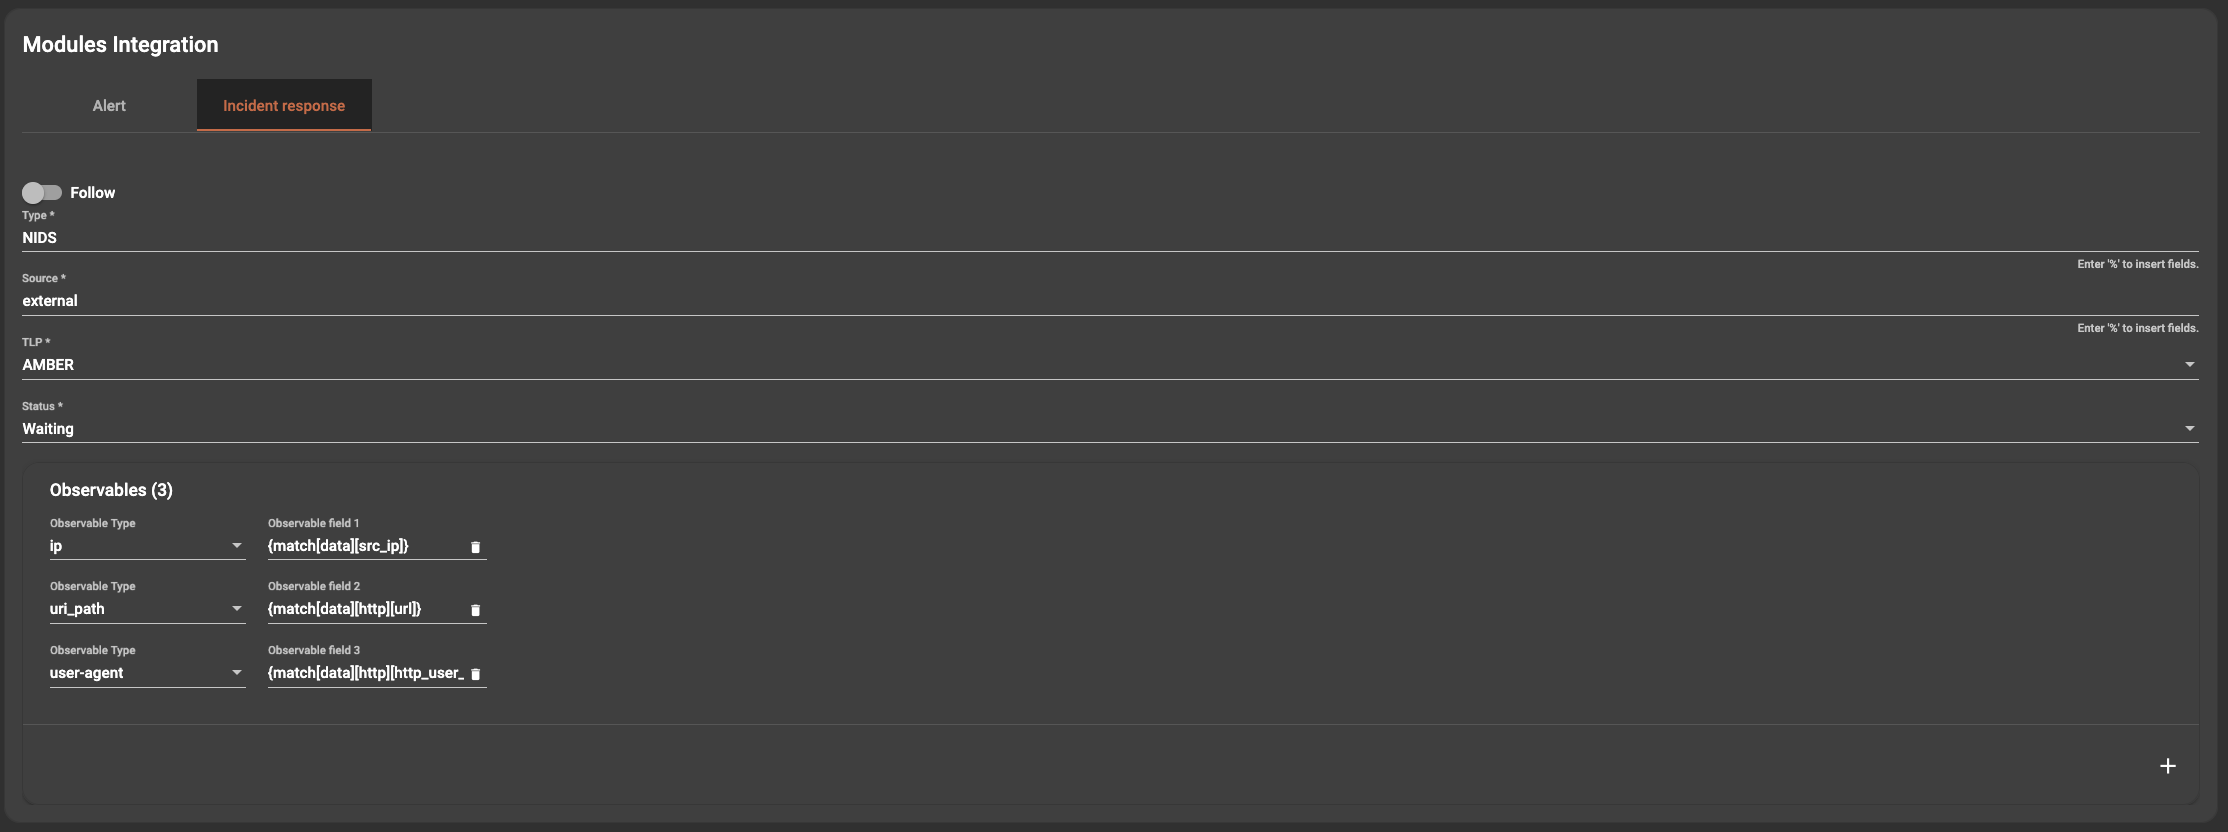
The severity rating, the traffic light protocol (TLP) and observables are very important. When adding an observable, an observable type must be chosen and mapped to a field using the % dropdown as indicated above. Please note that the field chose must match the expected observable type for enrichment to work e.g. if you were to choose the observable type as IP and map it to a field with a string, such as url, all lookups for enrichment will fail.
Once your editing is complete you can click to save the rule.