
Metrics
Metrics provides some metrics on the backend systems to enhance performance. Metrics has a health monitor used to monitor your cluster, stack health, and detailed statistics. Using the web interface, this is available on the Metrics - Grafana Elasticsearch Dashboard.
Grafana allows you to query, visualize, alert on and understand your metrics no matter where they are stored. With Grafana, you can create, explore, and share dashboards with your team and foster a data driven culture.
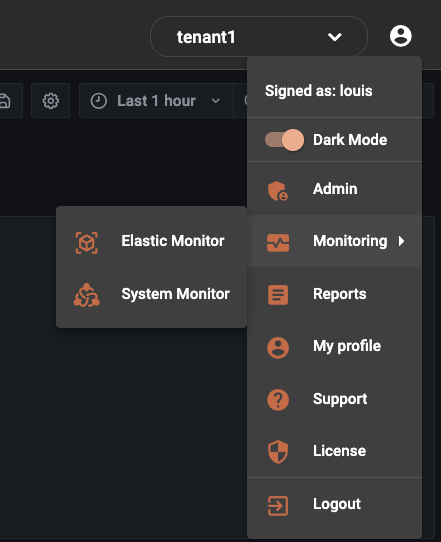
To access the metrics page please Click on your profile icon and then monitoring followed by system monitor.
Metrics: Data Source
Grafana supports many different storage backends for your Data Source. Each Data Source has a specific query editor that is customized for the features and capabilities that the Data Source exposes.
Grafana supports the following data sources:
Graphite
InfluxDB
OpenTSDB
Prometheus
Elasticsearch
CloudWatch
MySQL
PostgreSQL
The query language and capabilities of each Data Source are very different. Data from multiple Data Sources can be combined onto a single Dashboard, but each Panel in the Dashboard is tired to a specific Data Source.
In your instance all the required alerts and metrics have been pre-loaded for you. There is no requirement to modify these settings.