
Optimizing alerts
The default rules supplied by SIEMonster was created to be generic enough to cover the basic needs of diverse environments between thousands of clients. As each client environment is unique, it will become important to fine tune rules to deliver the optimal output for your specific environment. This section will cover how to determine noise levels in certain alerts and then fine tune the rules to exclude those.
🔖 NOTE: A general guideline when optimizing rules is to gauge the volume of alerts a responder or SOC analyst can process in a day. If you have rules that are generating thousands of alerts it will not be possible for the individual responder to take action on all of them. The volume a responder is able it process depends on various factors outside the control of SIEMonster such as skill level, environment knowledge and understanding. If a responder is able to process 50 alerts per day it would be a good measure to update the rule to not exceed that count.
Basics of filtering
For this example, we will be using the NIDS Minor rule from the default ruleset.
rule.groups: suricata AND data.event_type:alert AND data.alert.severity:3 AND NOT data.alert.category: ("Not Suspicious Traffic" OR "Generic Protocol Command Decode")Originally the rule started out as the following:
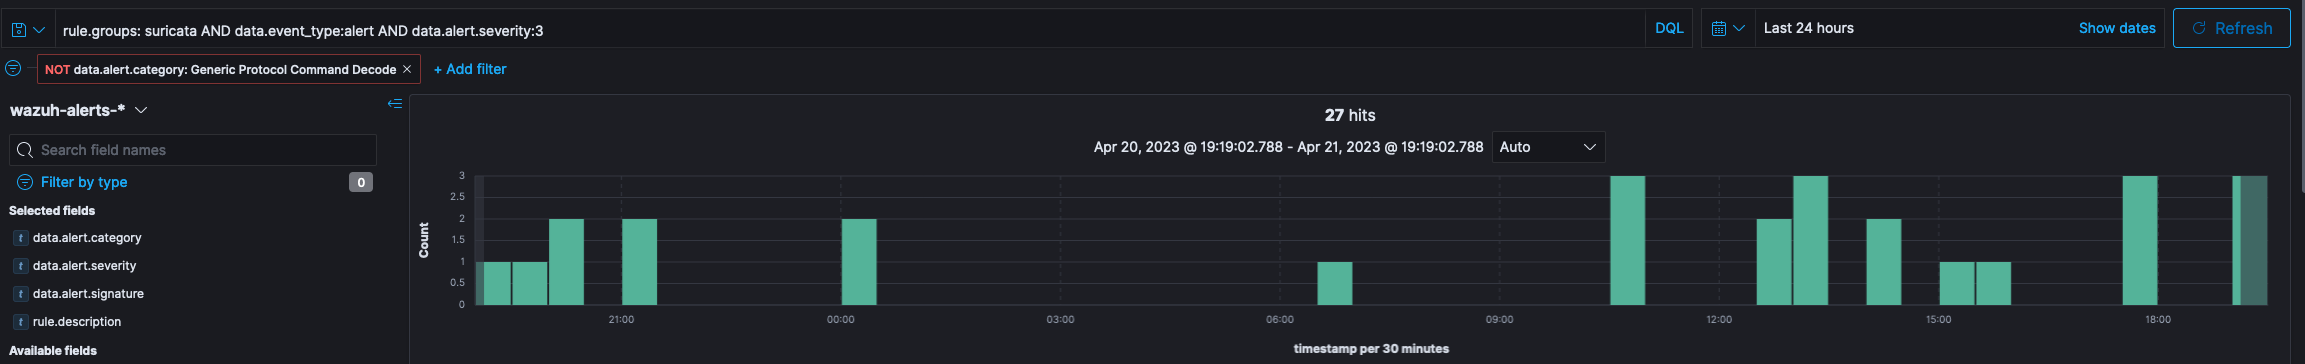
rule.groups: suricata AND data.event_type:alert AND data.alert.severity:3If we were to filter the events in the Event Search interface with this string the following would be the result over a 24 hour period in the lab environment. Suricata has three severity levels, 1, 2 and 3. Three being the lowest.
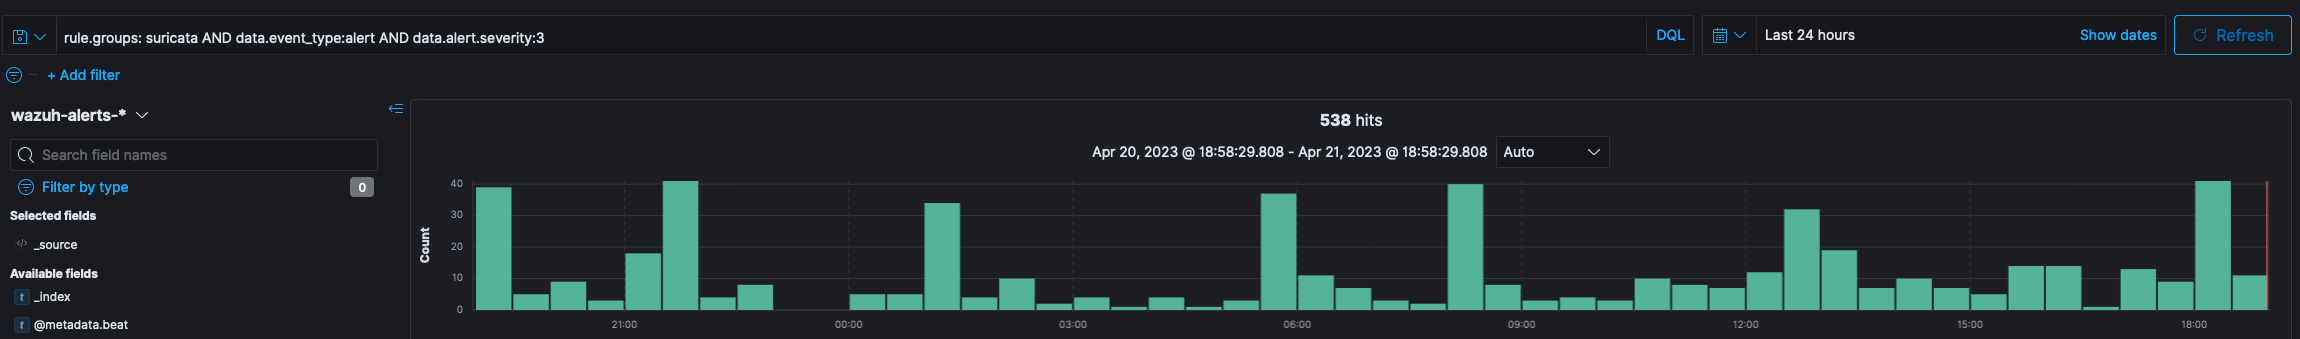
Even though this number may seem low in real life scenarios, processing all of these alerts would be significantly time consuming. The best approach would be to filter it.
🔖 NOTE: As with all log types, it is important to have a reasonable understanding of the structure for the specific log source. In the examples being used, the NIDS logs have a static structure that includes a rule description, a severity and an alert type. Before looking at fine tuning, review the log structure and ensure you have sufficient understanding to process the log type. This is imperative for event review, threat hunting and rule optimization.
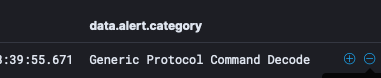
The simplest way to analyze what is noise and non-critical is to add columns to the default view of the search base on fields in the event logs that are important. For this example we will be using rule.description, data.alert.severity, dta.alert.signature and data.alert.category.
To add the columns, expand any of the events that match the search string as shown in the screen capture above. Next to each field you will be able to spot the following shortcuts

These shortcuts provide the following basic functions in sequence:
filter for
This will filter the results to this field and value
exclude
This will filter the results to exclude this field and value
add to table
Adds the field to the column for comparison
Exists
Checks if the field exists and will filter events based on a true result.
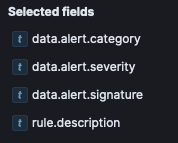
For this process we will focus on the “add to table” option. Once the fields specified has been added, your view should look similar to this. The sequence of the columns are irrelevant and can be controlled with the shortcuts next to the column heading.
On the left hand side, there is a section named selection fields. This will contain all the column names (field names) that were added to the table.
If you were to click on any of these, it will provide you with a percentage breakdown of the values in these fields for the top five.
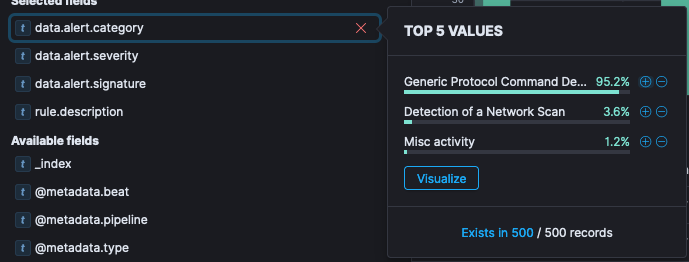
In the above, you can see that “Generic Protocol Demand Decode” constitutes 95.2% of the 500 events returned by the search.
🔖 Note: The event search interface by default returns 500 lines for any search. This is for efficiency reason. The counter at the top provides the full count for the time period specified. In this case 538 events over 24 hours.
At this point you can investigate what the category means and once review establish if the event is worth manually processing or not. In this example, “Generic Protocol Demand Decode”, is a low level NIDS alert relating to packets, packet segmentation and lower level traffic events. These are generally innocuous and can be used as supplementary information when review a case but not primary data. To filter this out of the result, the minus inside the circle next to the summary can be clicked.

Alternatively, the same minus in a circle can be clicked in the data table of the main result
Once this has been clicked, a filter will be observable at the top of the screen
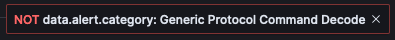
This will exclude the events that have now been trimmed by clicking the shortcut. Incidentally, this also shows you what text to add to your rule to filter it from the alerting interface. The result of this filtering action below clearly demonstrates how many events were filtered from the result as the total of matching events has dropped from 538 to 27. This indicates the power of fine tuning.
At this point our rule will have been adjusted to the following based on the review done above.
rule.groups: suricata AND data.event_type:alert AND data.alert.severity:3 AND NOT data.alert.category: "Not Suspicious Traffic"Not included in the results displayed is another category that can be excluded that may come up with valid traffic on the network and that is "Not Suspicious Traffic". When you are filtering on one field for more than one value, it is recommended to “group” the event values while using a single field descriptor. The two examples below provide an example of good formatting vs bad formatting.
Good formatting:
rule.groups: suricata AND data.event_type:alert AND data.alert.severity:3 AND NOT data.alert.category: ("Not Suspicious Traffic" OR "Generic Protocol Command Decode")Bad Formatting:
rule.groups: suricata AND data.event_type:alert AND data.alert.severity:3 AND NOT data.alert.category: "Not Suspicious Traffic" AND NOT data.alert.category: "Generic Protocol Command Decode"The differences can be observed clearly in the examples above. Not only is the rule with the good formatting more concise and readable, it is also more sensible from a resource and processing perspective. Also note that explicit AND/OR operators between values should always be used. In the example below, the rule would work but would be drastically less efficient than the good formatting example.
rule.groups: suricata AND data.event_type:alert AND data.alert.severity:3 AND NOT data.alert.category: ("Not Suspicious Traffic" "Generic Protocol Command Decode")In the example above, the OR value was stripped from the category filters being used. The results will still be found but because the operator isn’t explicitly defined, the system will attempt to decide which one (AND or OR) should be present.
Wildcards
The rule formatting allows for wildcard use. That being said, wildcards should only be used if absolutely no other option is available. Wildcard matching can be extremely resource intensive and when incorrectly use cause system slow down or in some cases the rule module may stop processing. In the example below, some text has been replaced by wildcards.
rule.groups: suricata AND data.event_type:alert AND data.alert.severity:3 AND NOT data.alert.category: "Not Suspicious Traffic" AND NOT data.alert.category: *Generic* AND NOT data.alert.category: *Suspicious*The example search will generate significant load on the environment as it will search for additional text in the field both before and after the specific text. This example is an example of the worst possible search string and should be avoided at all cost.
Please take your time when creating rules. Rules, if properly crafted will need minimal modification once utilized in production.