
Threat modeling user interface
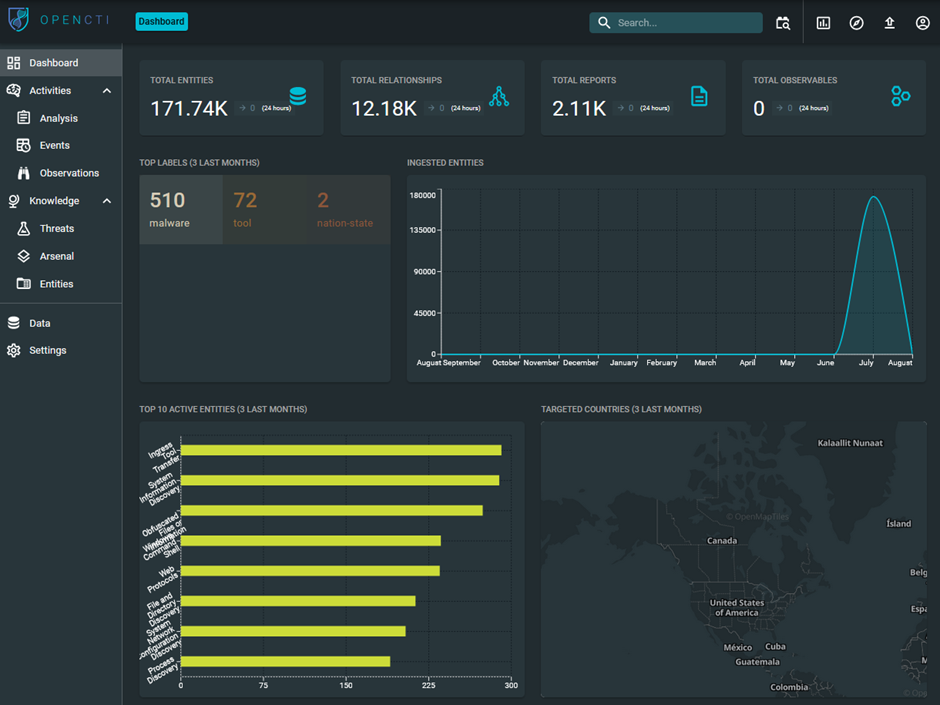
Dashboard:
OpenCTI platform provides a powerful knowledge management database with an enforced schema especially tailored for cyber threat intelligence and cyber
operations. With multiple tools and viewing capabilities, analysts are able to explore the whole dataset by pivoting on the platform between entities and relations. Relations having the possibility to own multiple context attributes, it is easy to have several levels of context for a given entity.
Navigate to Home > Threat Modelling to open the Dashboard. The Dashboard will fill up progressively as you import data.
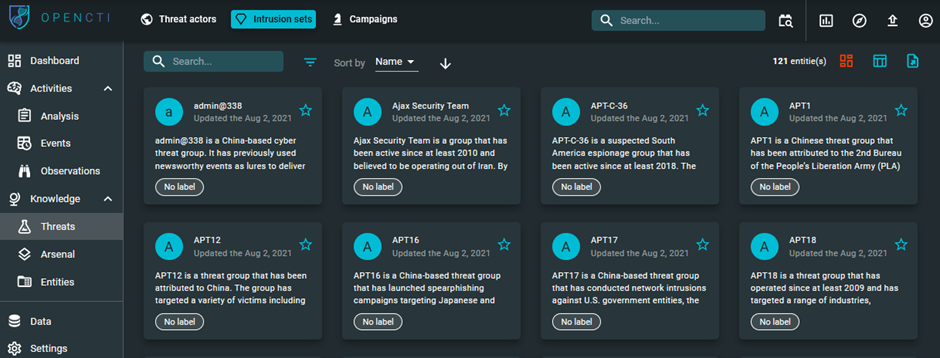
Threats:
The Threats service allows you to go through all the data in the platform organized by:
Threat actors
Intrusion sets
Campaigns
Incidents
Malwares
To view the existing Threats, click the icon from the left navigation pane to visualize all the threats related data split in different tabs.
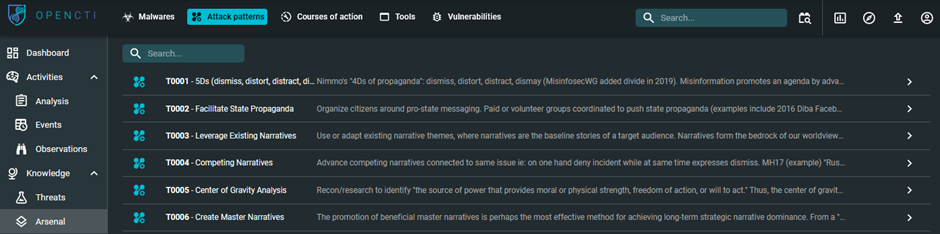
Attack patterns:
Click the Attack Patterns tab to display among all the Techniques, Tactics and Procedures (TTPs) which may be used during an attack. This covers all the kill chain phases as detailed in the MITRE ATT&CK framework but also tools, vulnerabilities and identified courses of actions which can be implemented to block these techniques.
Obervables:
Click the Observables tab to display all the technical observables which may have been seen during an attack, such as infrastructure or file hashes.
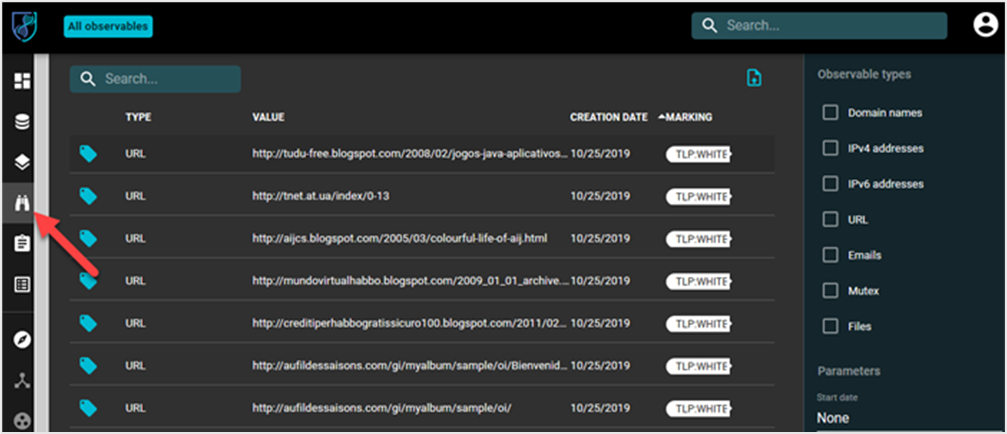
The goal is to create a comprehensive tool allowing users to capitalize technical (such as TTPs and observables) and non-technical information (such as suggested attribution and victimology etc.) while linking each piece of information to its primary source (a report, a MISP event, etc.).
All observables are linked to threats with all the information needed to the analysts to fully understand the situation, the role played by the observable regarding the threat, the source of the information and the malicious behavior scoring.
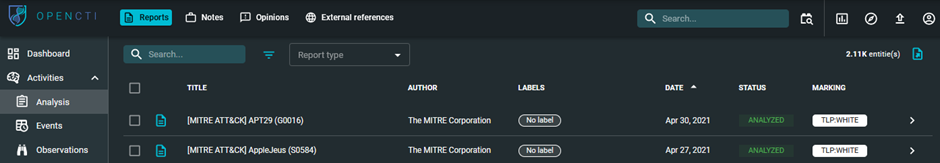
Analysis:
In this tab are all the reports which have been uploaded to the platform. They will be the starting point for processing the data inside the reports.
Entities:
This tab contains all information organized according to the identified entities, which can be either Sectors, Regions, Cities, Organizations, or Persons, targeted by an attack or involved in it. Lists of entities can be synchronized from the repository through the OpenCTI connector or can be created internally.
Explore:
This tab is a bit specific, as it constitute a workspace from which the user can automatically generates graphs, timelines, charts and tables from the data previously processed. This can help compare victimology with each other, or the timelines of attacks.
OpenCTI allows analysts to easily visualize any entity and its relationships. Multiple views are available as well as an analytics system based on dynamic widgets. For instance, users are able to compare the victimology of two different intrusion sets.
Connectors:
In this tab, you can manage the different connectors which are used to upload data to the platform.