KB - Troubleshooting missing XDR/Wazuh metrics
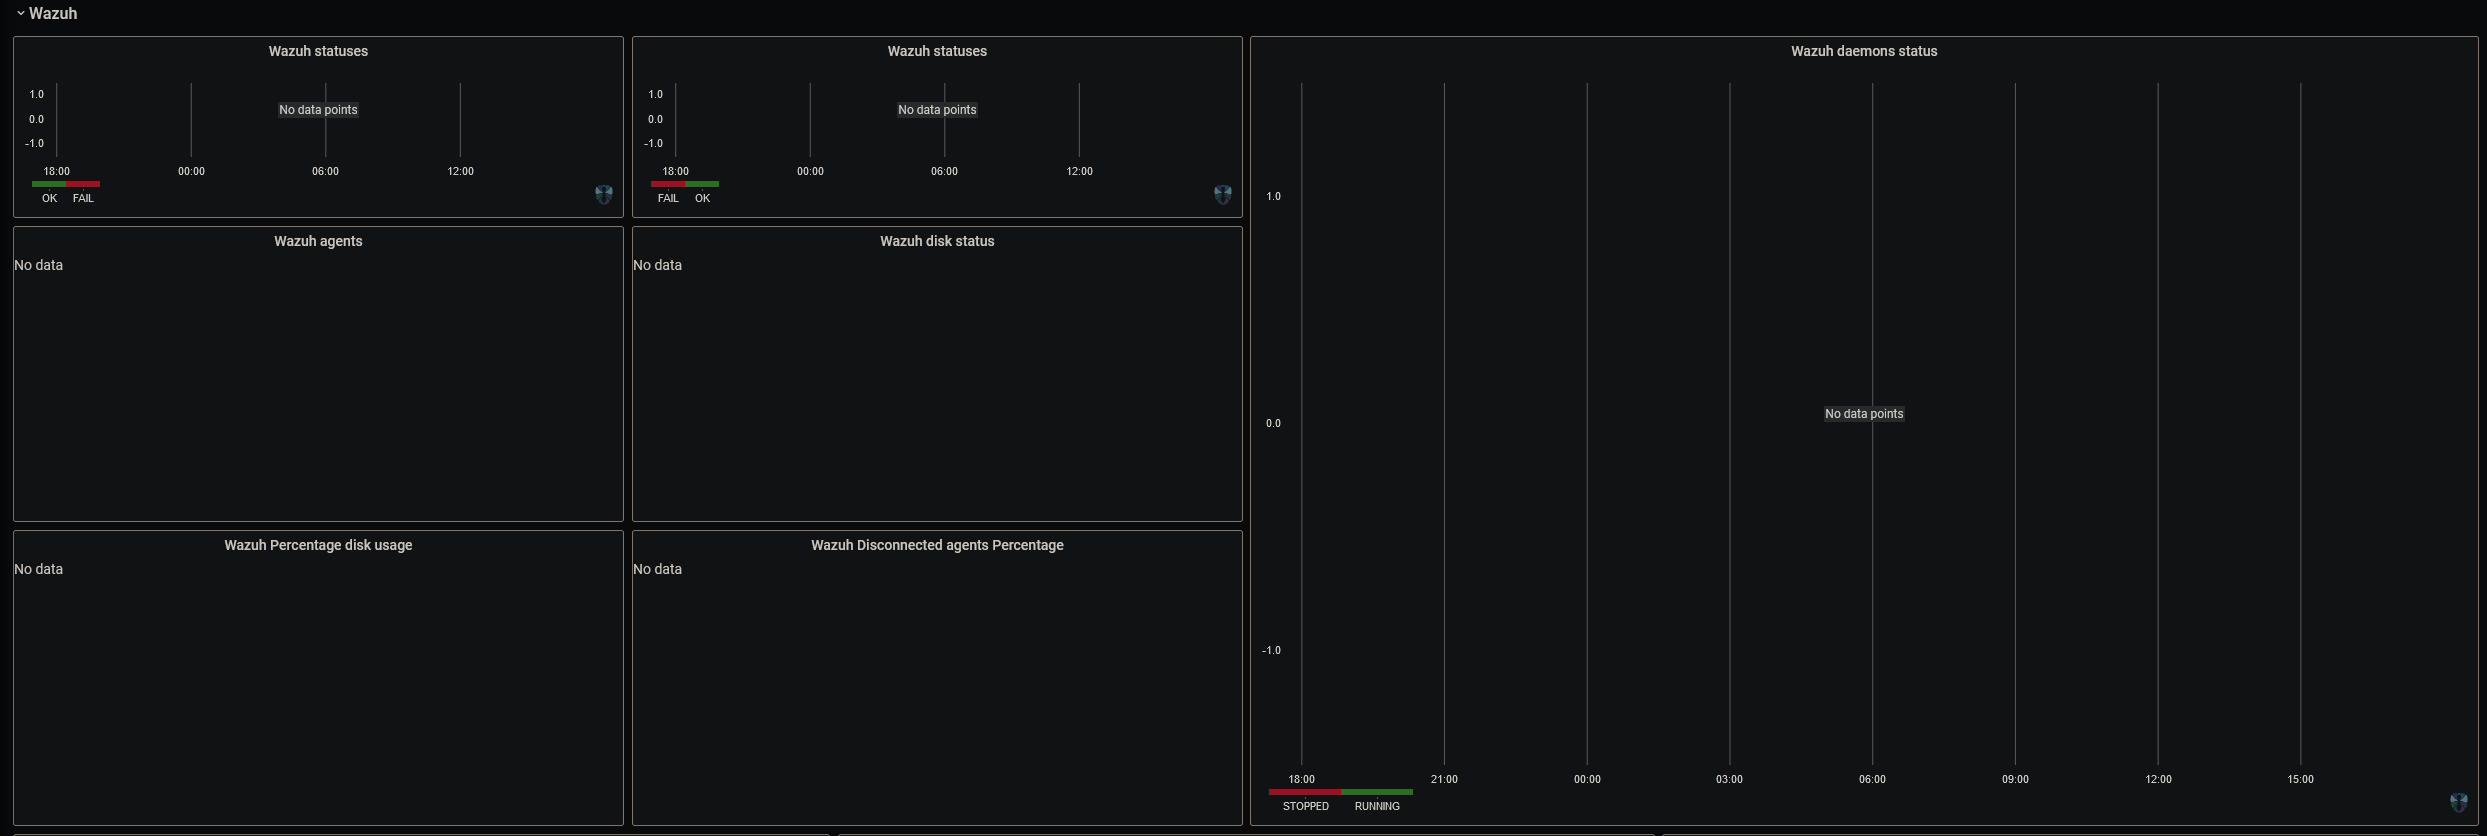
In some cases you may be faced with a situation where certain XDR metrics are not being populated. An example of such a situation is listed displayed below.

SItuations where this can occur can be communication issues through a load balancer, loss of communication as services migrate to another node or service failure. Additional indicators that this is being experienced is alerts like the following when you retrieve the XDR pod logs.

The line “TypeError: Cannot read properties of undefined (reading 'wazuhAgents')” indicates that the XDR controller cannot read the relevant data.
Please review the section https://docs.siemonster.com/current/kubernetes-reviewing-logs-and-events for instruction on how to extract the logs. A command example has been supplied below. Tenant1 is used in the example. Please replace this with the namespace of the tenant experiencing the problem.
kubectl -n tenant1 logs -f tenant1-wazuh-0 |grep -i waz-ctrlTo resolve the issue, please restart the XDR pod by using the following command. Please replace tenant1 with the relevant namespace for the tenant experiencing the issue.
kubectl -n tenant1 delete pod tenant1-wazuh-0Wait for the pod to enter the running state. You can check it with the following command
watch -n3 "kubectl -n tenant1 get pod tenant1-wazuh-0"Once the pod shows as running, close the watch process by Pressing [CTRL]+[C]
Now run the command example used previously to follow the logs and monitor for any errors or issues
kubectl -n tenant1 logs -f tenant1-wazuh-0 |grep -i waz-ctrlAt the same time also open the metrics panel and switch the time frame for 5 minutes as per below screenshot

Wait for the data to start appearing. This can take up to 15 minutes. If additional errors are displayed please continue troubleshooting those errors specifically.
